Introduction to the Environmental Problem
The keywords, defined
- Environment — everything that surrounds living organisms. It comprises the atmosphere (air), hydrosphere (water bodies), lithosphere (solid earth, soil & rock) and the biosphere — the thin shell where the other three meet and which makes life on earth possible.
- Pollution — to pollute is to defile, corrupt, contaminate. Formally: an undesirable change in the physical, chemical, or biological characteristics of air, water, or soil that may harmfully affect life or create a potential health hazard for any living organism.
- Engineering — the profession that uses scientific principles to either meet man's need or solve man's problem. Environmental engineering applies these principles to both: meet need without creating environmental harm, and solve the problems already created.
How did the environmental problem start?
1. Human population growth
Before the Industrial Revolution, world population grew slowly and almost linearly. After the eighteenth century the growth rate became exponential. More people = more demand for food, energy, materials, transport, and waste sinks.
2. Industrialization
The Industrial Revolution began the cycle of industrial growth that has produced wonders — and consequences. New chemicals are developed every day; many find their way into the environment via accidental leakage, manufacture, transport, or usage.
The course outline tracks five "Industrial Revolutions" — the most recent (5.0) about integrating AI more effectively into society.
Three notorious case studies
- The Bhopal Tragedy (1984, India) — methyl isocyanate gas leak from a Union Carbide pesticide plant, killing thousands and injuring hundreds of thousands.
- Erin Brockovich (Hinkley, California) — hexavalent chromium contamination of groundwater by Pacific Gas & Electric, dramatised in the 2000 film.
- Love Canal (Niagara Falls, NY, 1978) — homes and a school built on a buried toxic waste dump; the resulting health crisis triggered Superfund legislation.
All three illustrate how routine industrial activity can produce slow-moving, devastating environmental disasters when control fails.
Ecosystems: the units of the biosphere
The biosphere is built from many smaller ecosystems. Each ecosystem has two component types:
- Abiotic components — non-living: phosphorus, nitrogen, water, sunlight, soil minerals.
- Biotic components — living, which split further into:
- Producers — self-nourishing (e.g. plants).
- Consumers — eat producers to sustain life (animals, fish, insects, birds, mammals).
- Decomposers — bacteria and fungi breaking down dead organic matter back into chemical components for producers.
Until recently, human changes to ecosystems were small perturbations on a large stable system, absorbed by feedback loops (the homeostatic mechanisms that keep ecosystems stable). Today, perturbations are large enough to permanently upset natural cycles — and that is when we have pollution.
Two-way impact
Impact of man on the environment → Exploitation
Impact of environment on man → Pollution
Once we cross the homeostatic threshold and natural cycles are disrupted, the environment begins to impact us back — and that impact is what we call pollution.
The Lady and the Tiger — a parable for ECN 569
A king offered three young men a challenge — choose between two doors:
| Man | Action taken | Moral of the story |
|---|---|---|
| 1st | Refused the challenge — lived safely, died chaste | Can manage and survive without industries — and without their benefits OR their problems |
| 2nd | Hired consultants. After much money and time, they recommended a course of action. He opened the optimal door — and was eaten by a low-probability tiger | Do everything possible to prevent environmental problems — but recognise prevention is imperfect |
| 3rd | Took a course in tiger-handling | Take CHG 569 — learn what has to be done to eliminate or minimize environmental problems |
The 3 men represent all of us; the lady represents the benefits industrialisation brings to humanity; and the tiger represents the environmental problems associated with industrialisation. Welcome aboard.
Quotes that frame the discipline
Air Pollution & its Effects
What is air pollution?
"The earth is our mother — whatever befalls the earth befalls the sons and daughters of the earth."
Composition of normal air (sea level, 15 °C, 1 atm)
| Gas | % by volume |
|---|---|
| Nitrogen — N2 | 78.084 % |
| Oxygen — O2 | 20.948 % |
| Argon — Ar | 0.934 % |
| Carbon dioxide — CO2 | 0.0314 % |
| Neon — Ne | 0.001818 % |
| Methane — CH4 | 0.0002 % |
| Helium / Krypton / Hydrogen / Xenon | ≤ 0.0005 % each |
| Ozone, NO2, I2, CO, NH3 | trace |
Air pollution is, fundamentally, the disturbance of these proportions — usually by adding too much of a trace gas, or introducing one not on the list at all.
Causes — natural
- Forest fires
- Ash & sulphur gases from volcanoes
- Dust storms (esp. harmattan in West Africa)
- Gases & odours from natural decomposition
- Gases from swamps
- Esters & terpenes from vegetation
- Ozone from lightning
- Natural radioactivity
Causes — anthropogenic (man-made)
- Population explosion
- Deforestation
- Urbanisation
- Industrialisation
Major industrial sources: thermal power stations and automobiles. In most major cities, vehicular exhaust accounts for:
- 70 % of CO
- 50 % of HCs
- 30–40 % of nitrogen oxides
- 30 % of particulate matter
Classification of pollution sources
Stationary (point) sources
- Point — a fixed point such as a smokestack or storage tank, emitting from a single discharge location.
- Area — many small stationary sources that together affect regional air quality. Example: a community of homes using kerosene stoves — each contributes a tiny amount, but the aggregate matters.
Mobile sources
- Line — highway vehicles along a road.
- Area — aircraft, port vessels, and others spread over a region.
Primary pollutants — released directly
- Carbon compounds — CO2, CO
- Sulphur compounds — SO2, H2S
- Nitrogen oxides — NO, NO2, HNO3
- Fluorocarbons — insecticides, CFCs
- Ozone — O3 (also a secondary pollutant in tropospheric smog)
- Metals — lead, nickel, arsenic, cadmium
- Particulate matter — fly ash, dust, grit, soot (solid, liquid droplets, or gases)
- Toxicants — complex chemical substances released during manufacture
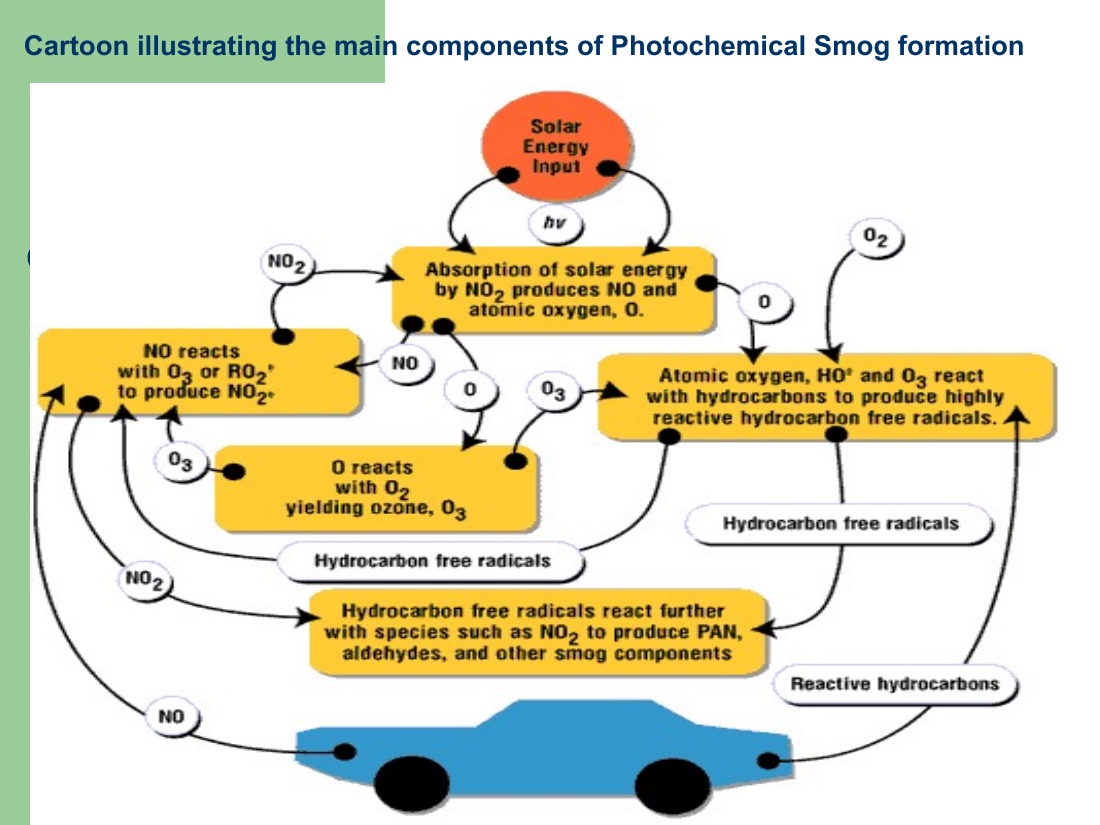
Secondary pollutants — POPs (Photochemical Oxidation Products)
Formed by photochemical reactions between NOx, hydrocarbons, and O3 in the atmosphere in the presence of sunlight. POPs are often more toxic than the primary pollutants that cause them.
Principal POPs:
- PAN — peroxyacetyl nitrate (CH3C(O)OONO2)
- Peroxybenzoyl nitrate
- Ozone at ground level
- Aldehydes & olefins
Photochemical smog becomes problematic during atmospheric inversions, when pollutants can't disperse vertically.
Effects of air pollution — overview
Four broad categories:
- Atmospheric characteristics — visibility reduction (light scattering), fog formation around dust nuclei, reduced solar radiation at ground level, altered temperature and wind distribution.
- Vegetation — leaf damage, reduced growth, reduced crop yield (with measurable concentration thresholds and exposure times).
- Human health — directly (inhalation, ingestion) and indirectly (skin contact). The most damaging effects occur in the respiratory system.
- Materials — corrosion of metals, discolouration of buildings/paints, weakening of leather/rubber/paper, fading of fabrics.
"Effects are not meaningful unless exposure time and threshold concentration are given." — i.e. dose & duration, not just presence.
Vegetation thresholds — dose-response data
| Pollutant | Symptom | Threshold (ppm / μg m-3) | Sustained exposure |
|---|---|---|---|
| O3 | Suppressed growth, leaf collapse, necrosis | 0.06 / 118 | 4 hrs |
| SO2 | Chlorosis (loss of green chlorophyll) | 0.03 / 78.5 | 8 hrs |
| PAN | Reduced crop yield, bronzing on lower leaf surface | 0.01 / 50 | 6 hrs |
Units of measurement: ppm ↔ μg/m³
Concentrations of gaseous pollutants can be reported in either parts-per-million by volume or in mass per unit volume. The conversion at 25 °C, 1 atm is:
Derivation:
1 ppm = 1 m3 pollutant per 106 m3 air = 40.9 × MW · 10-6 g/m3 = 40.9 × MW μg/m3
Tip: the side-tool calculator (Σ button) does this for you live — or open it manually with C.
The respiratory system — defenses against particulates
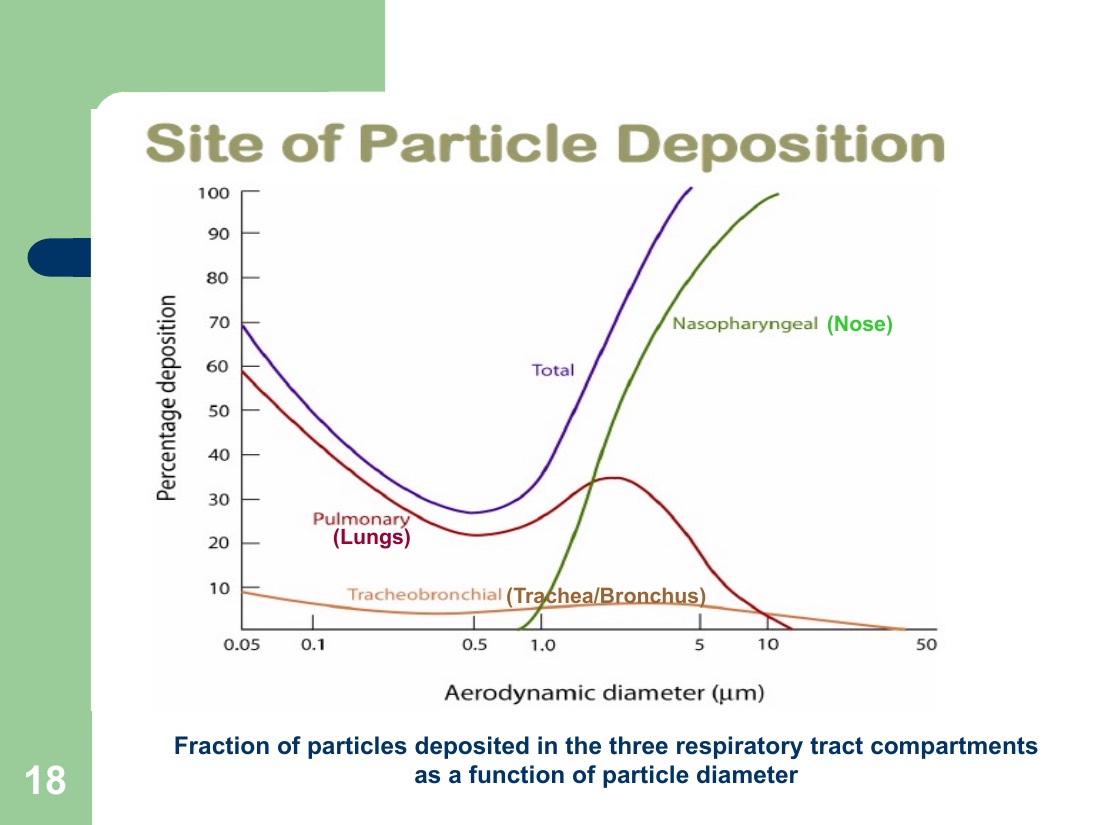
Air enters the trachea, which divides into bronchi (left & right) leading to the lungs. The bronchi divide and re-divide, ending in millions of tiny air sacs (alveoli) where O2/CO2 exchange happens. Particulates are filtered out at three lines of defense:
- Nostril hairs — 1st line: 95 % of particles with diameter Dp > 5 μm are blown out or swallowed.
- Cilia in trachea / bronchus — 2nd line: Dp < 5 μm get coughed out.
- Brownian motion — Dp < 0.01 μm reach the lungs but are easily exhaled.
Problematic range: 0.01 μm < Dp < 0.1 μm — these get deposited in the alveoli where they can:
- Cause extra resistance to O2/CO2 diffusion
- Chemically react with lung tissue
- Be absorbed into the bloodstream through the thin alveolar membrane
Specific particulates — health effects & sources
| Particulate | Effect | Source |
|---|---|---|
| Lead | Anemia, high BP, brain & kidney damage, neurological disorders, cancer, lowered IQ | Metal refineries, lead smelters, battery manufacturers, iron & steel producers |
| Cadmium | High BP, interference with zinc & copper metabolism, kidney damage | Coal & zinc mining, plastic incineration, refining of metals, tobacco smoke |
| Nickel | Respiratory symptoms, lung cancer | Combustion of coal, diesel, tobacco smoke, catalysts, steel manufacture |
| Asbestos | Shortness of breath, coughing, asbestosis (lung damage), lung cancer | Building & insulating materials |
Standards report particulate matter by mass (μg/m³), but inert particles often carry toxic substances on their surfaces. The substances doing the harm are not always the particles themselves.
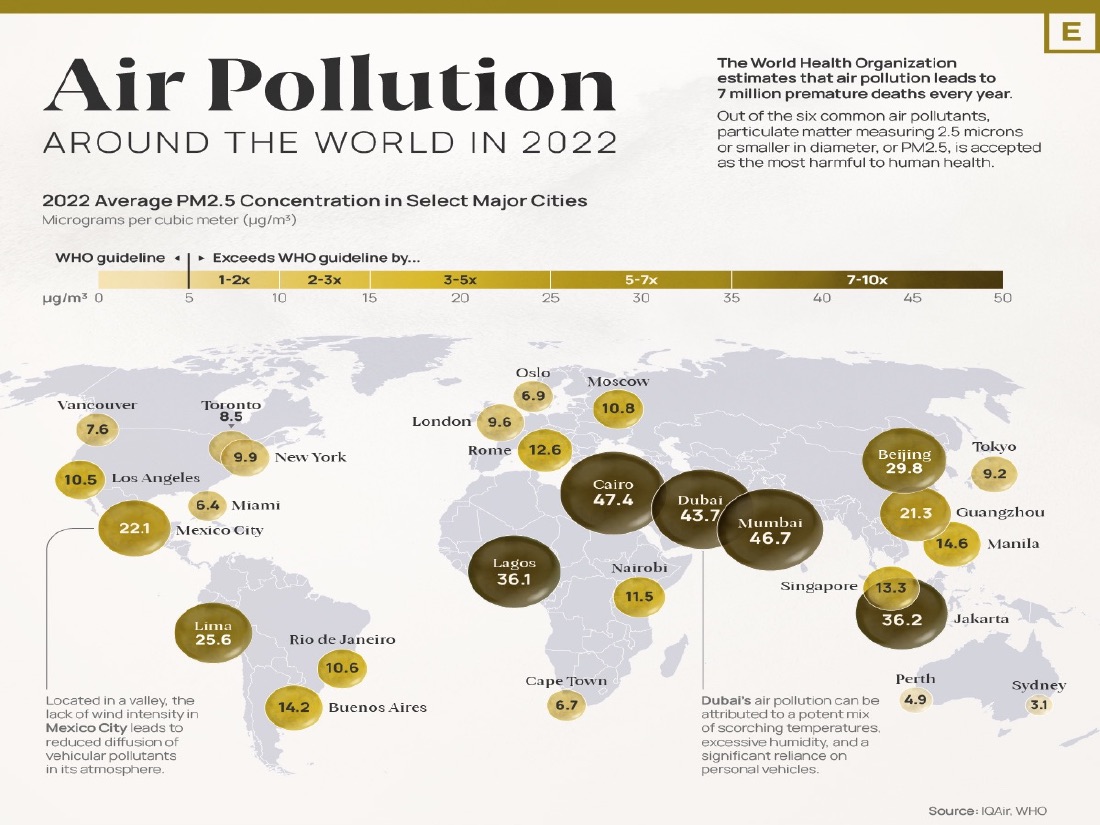
WHO PM2.5 guideline (2021 update)
According to the AQLI (2022), 97.3 % of the world's population is exposed to PM2.5 levels above WHO guidelines. This takes ~2.2 years off global average life expectancy. In South Asia residents may lose up to 5 years; 37 of the world's 40 most polluted cities are there.
Fine particles travel hundreds of kilometres — ~30 % of pollution in India's Punjab originates in Pakistan; ~30 % in Bangladesh's largest cities is traced back to India.
Gaseous effects — solubility decides where damage occurs
The gas defense system is the body's weakest: gases dissolve into the moist mucus that coats the respiratory tract. Where damage happens depends on solubility:
- Soluble gases (SO2, NH3) — absorbed in the upper respiratory tract, causing bronchial constriction. The body produces more mucus to fend off the irritant — vicious cycle.
- Less soluble gases (CO, NOx) — pass deeper, into the alveoli, where they compete with O2 for binding sites in haemoglobin.
Hb has 210× more affinity for CO than for O2. CO-haemoglobin (COHb) also prevents release of O2 at tissues.
CO toxicity — concentration vs time
| Symptom | Concentration | Time limit |
|---|---|---|
| Reduced mental alertness | 10–15 ppm | 8 hrs |
| Reduced mental alertness | 50 ppm | 90 min |
| Headaches | 30 ppm | 8 hrs |
| Heart attack, cardiovascular disease, impaired fetal development, death | > 600 ppm | 6 hrs |
CO primary effects fall on the most O2-sensitive organs: brain, central nervous system, and heart.
Other key gaseous pollutants — health effects
| Gas | Health effects |
|---|---|
| NO2 | Increased susceptibility to respiratory infections, lung irritation, cough, chest pain, breathing difficulty |
| SO2 | Eye irritation, wheezing, chest tightness, shortness of breath, lung damage |
| O3 | Eye & throat irritation, coughing, respiratory tract problems, asthma, lung damage |
Material damage — what pollutants attack what
| Material | Damage | Pollutant |
|---|---|---|
| Metal | Surface spoilage, rusting | Acid gases |
| Buildings | Discolouration, leaching | Acid gases |
| Paints | Discolouration | Acid gases |
| Leather | Weakening, embrittlement, powdered surfaces | SO2, organics |
| Rubber | Cracking, weakening | O3 |
| Paper | Embrittlement | SO2 |
| Fabrics & dyes | Discolouration, fading, weakening | Particulates, acid gases, POPs |
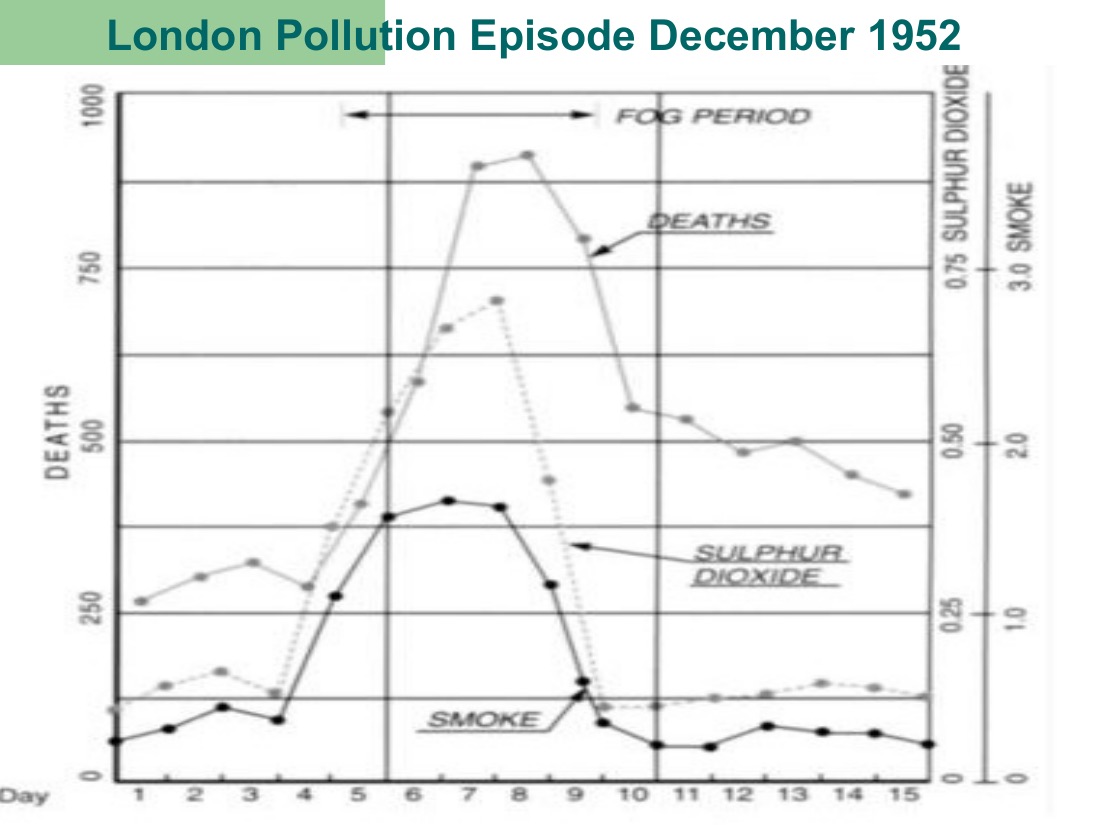
Pollution Episodes — when atmosphere fails to disperse
Ventilation depends on two mechanisms:
- Horizontal wind flow — cessation gives calm.
- Vertical convection — suppression gives atmospheric inversion.
POLLUTION BUILDUP + STAGNATION = EPISODE
Major pollution episodes — historical case studies
| Event | Outcome | Source / mechanism |
|---|---|---|
| Meuse Valley, Belgium · 1930 | ~60 deaths, ~6,000 ill. Nausea, short breath, stinging eyes, burning throats | Steel works, sulphuric acid plants, glass factories, zinc works. SO2 9–38 ppm (industrial limit 1 ppm) |
| Donora, PA · 1948 | 43 % of 12,300 fell ill, 17 % moderate, 10 % severe | Steel, sulphuric acid, zinc smelting in stagnant fog. Fluorine from zinc smelting, trapped by stagnation, was the primary killer (victims had F levels 20× normal) |
| London · Dec 1952 | 4,700 deaths in 5 days; 100,000+ took ill. "Smoky black fog" — visibility almost nil | Low-grade high-sulphur coal for heating & electricity. SO2 9–38 ppm. Synergy: SO2 + particulates |
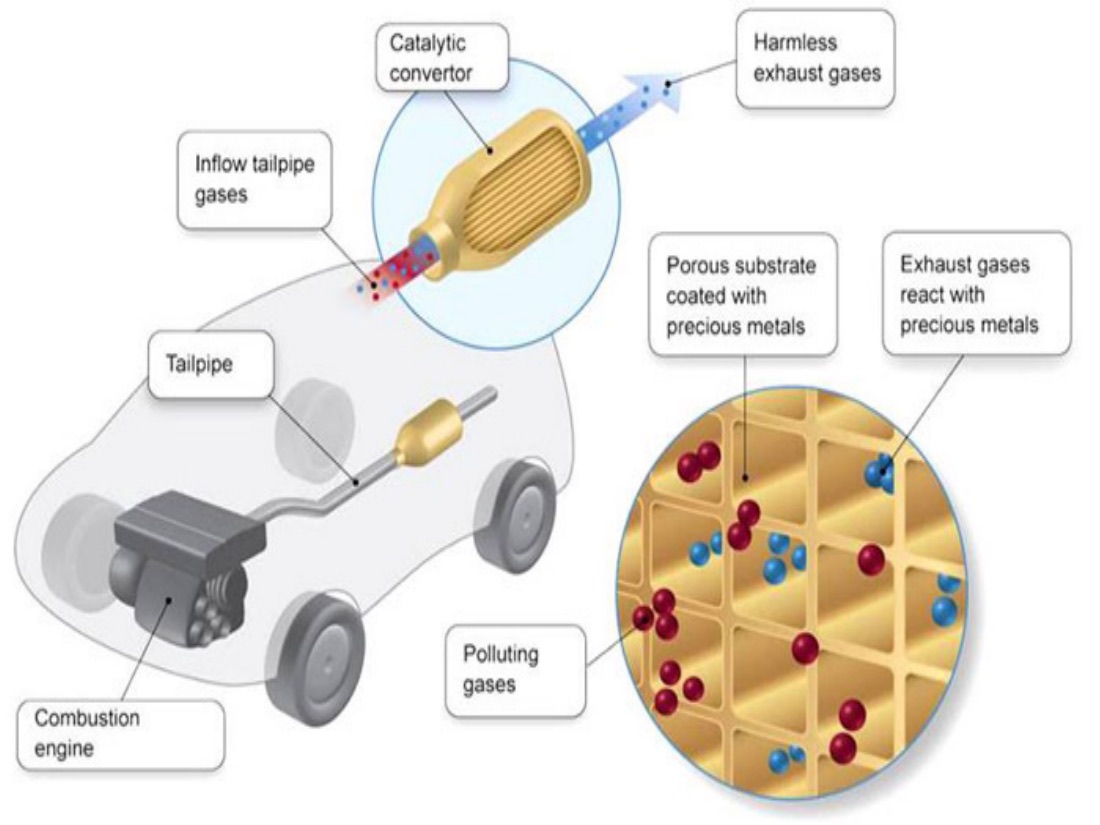
| Los Angeles · 1973 (1st recorded 1940) | Eye, nose, lung irritation; loss of visibility; respiratory problems | High petrol consumption (vehicular). POPs from unburnt HC + NO2 + sunlight. Led to the introduction of the 3-way catalytic converter |
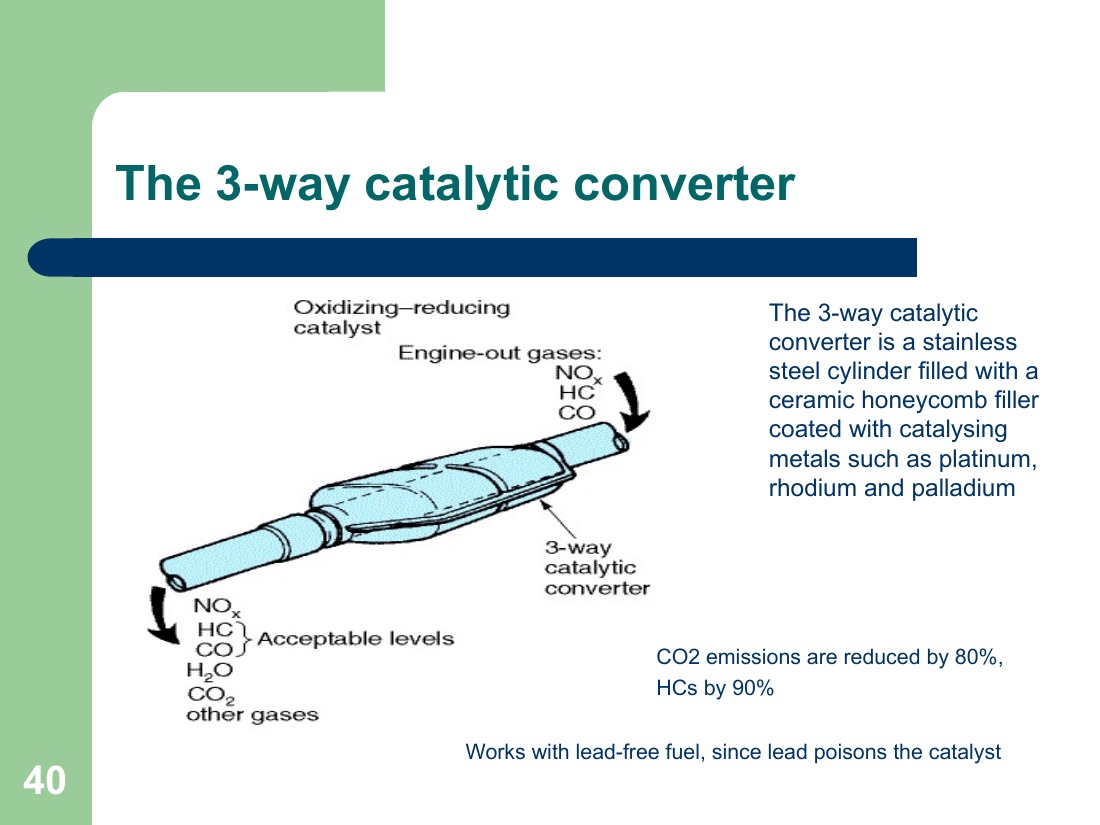
The 3-way catalytic converter
A stainless-steel cylinder containing a ceramic honeycomb filler coated with catalysing metals (platinum, rhodium, palladium). Mounted in the exhaust line of petrol vehicles.
Reduces:
- CO emissions by 80 %
- HC emissions by 90 %
- NOx reduced via redox over Rh
Requires lead-free fuel — lead poisons the catalyst, irreversibly destroying its activity. This is why leaded petrol was phased out worldwide.
Global effects — local actions, planetary consequences
Three classic global air-pollution problems where one country's emission is another country's damage:
- Acid rain
- Global warming
- Ozone layer depletion
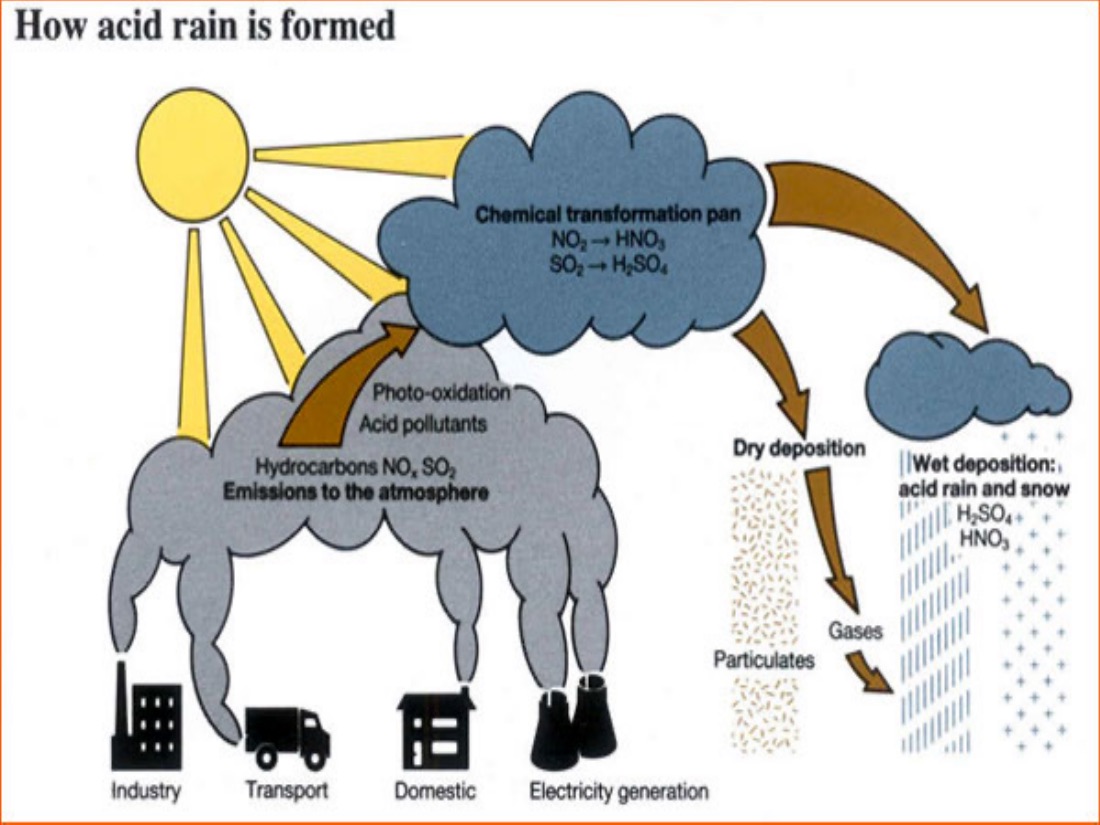
1. Acid rain
Causes: combustion of fuel, transportation, industrial SO2 and NOx emissions (which form H2SO4 and HNO3 with atmospheric water).
Effects:
- Lowers pH of water bodies — toxic to aquatic life; increases dissolved-metal toxicity
- Increases soil acidity → decreased nutrient availability and release of toxic metals
- Disintegrates buildings, statues, monuments
Cross-border injustice: Scandinavian countries suffer most from European emissions; Canada from US emissions. The polluter and the affected country are often different.
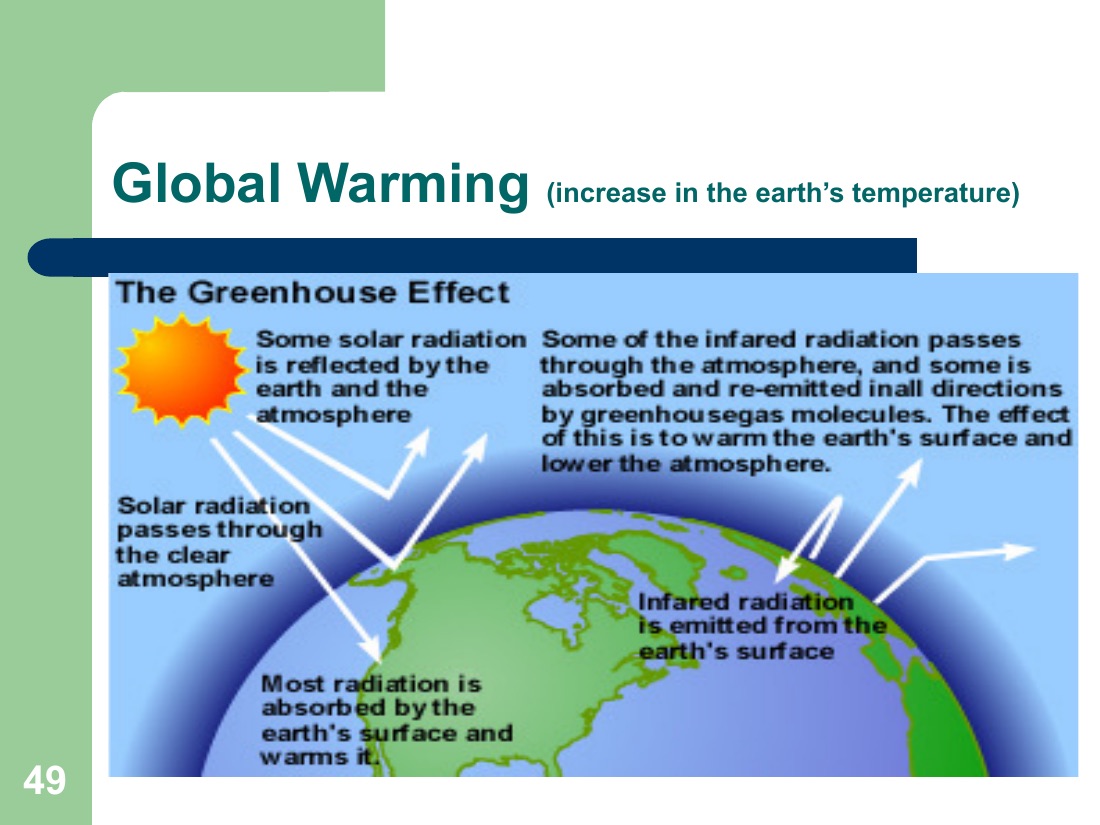
2. Global warming — the greenhouse gases
Causes: emissions of greenhouse gases (GHGs) and removal of GHG sinks (deforestation).
| GHG | GWP (CO2-equivalent over 100 yrs) |
|---|---|
| Carbon dioxide (CO2) | 1 (reference) |
| Methane (CH4) | 21 |
| Nitrous oxide (N2O) | 310 |
| Hydrofluorocarbons (HFCs) | 140 – 11,000 |
| Perfluorocarbons (PFCs) | 6,500 – 9,200 |
| Sulphur hexafluoride (SF6) | 23,900 |
Effects: extreme weather (droughts, floods); rising sea level (~75 % of environmental water is locked in icecaps & glaciers); shifts in agricultural climate zones; new disease vectors as pathogens spread.
A counter-question often raised: CO2 is 0.0314 % on Earth, 95.3 % on Mars (cold), 96.5 % on Venus (hot). What explains the difference? Atmospheric density: Earth ≈ 1.22 kg/m³, Mars ≈ 0.02 kg/m³, Venus ≈ 65 kg/m³ — Mars's thin atmosphere can't retain heat despite high CO2 %.
3. Ozone layer depletion — the chemistry
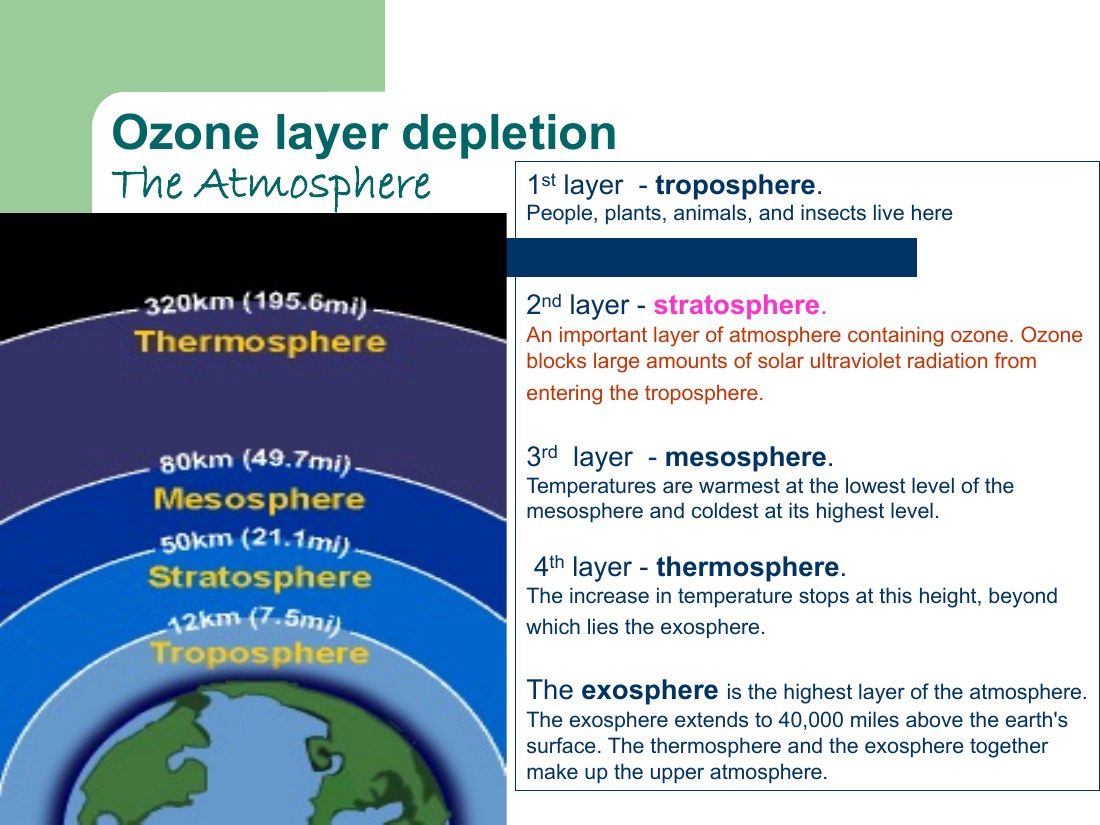
The atmosphere has 4 main layers (with the exosphere highest):
- Troposphere — where weather happens; people, plants, animals live here
- Stratosphere — contains the ozone layer that blocks UV radiation
- Mesosphere — coldest at top, warmest at bottom
- Thermosphere — temperature begins rising again; merges into the exosphere above
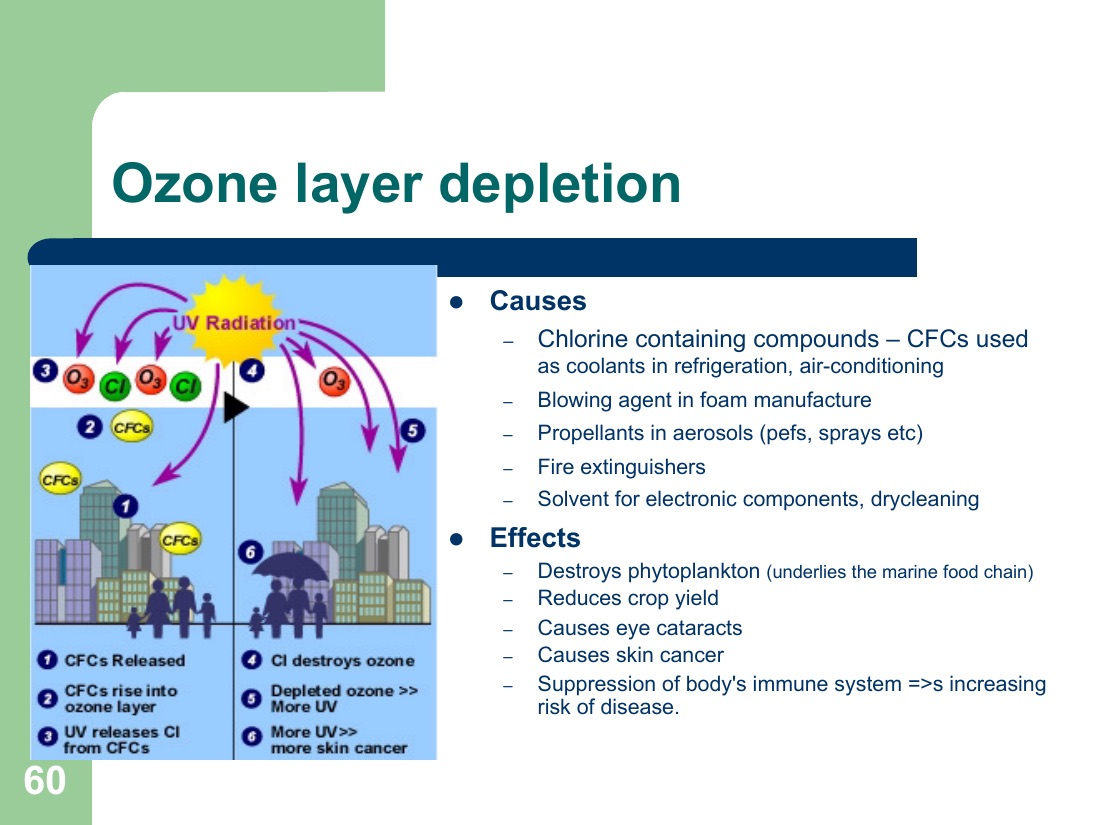
Ozone formation in the stratosphere
O2 + O· → O3 (ozone)
O3 + O· → 2 O2 (continuous regeneration)
Ozone destruction by CFCs
Cl· + O3 → ClO + O2
ClO + O· → Cl· + O2 ← chain repeats!
A single chlorine atom in the stratosphere can destroy up to 100,000 ozone molecules.
Sources of ozone-depleting CFCs
- Refrigeration / air-conditioning coolants
- Blowing agents in foam manufacture
- Aerosol propellants (perfumes, sprays)
- Fire extinguishers
- Solvents for electronic-component cleaning, dry cleaning
Effects of stratospheric ozone loss
- Destroys phytoplankton — collapses the marine food chain at the base
- Reduces crop yield
- Eye cataracts
- Skin cancer
- Suppression of immune system → increased disease risk
CFCs were replaced by HFCs (ODP 0.005–0.2). But HFCs have GWP 140–11,000 — so we traded ozone depletion for a global-warming problem. The irony: HFC refrigeration cools rooms while the leaks warm the planet, requiring more cooling, requiring more leaks…
📑 Slide gallery — the lecturer’s exact figures
Pulled directly from the Module II PDF. These are the actual diagrams Tolu Ajayi shows in class — exam questions are commonly built directly from these.
Energy & the Environment
The energy story in one number
Energy is the capacity to do work. Per-capita energy use has risen from about 8 MJ/person/day at the dawn of agriculture to ~1,000 MJ/person/day today — a 125× increase. Most of that growth happened in the last 200 years and is fed almost entirely by fossil fuels.
Major non-renewable energy sources
1. Fossil fuels (coal, crude oil, natural gas)
Non-renewable — rate of extraction >>> rate of formation. Combustion in industry or transportation is the chief source of NOx, CO2, SOx, and unburnt hydrocarbons.
- Coal is the dirtiest fossil fuel. It supplies ~41 % of the world's electricity.
- Top users: China #1, India #2, USA #3.
- The US has only 4.23 % of world population and ~3 % of world fossil reserves, but consumes ~25 % of world fossil fuel — herein lies the politics. Many developed countries (USA, UK) want to reduce reliance on imports from politically unstable regions.
Current fossil-fuel use is widely held to be unsustainable on three axes — Environmentally, Economically, and Socially.
The Triple Bottom Line — the 3 Ps of sustainability
Decisions that ignore any one P aren't truly sustainable.
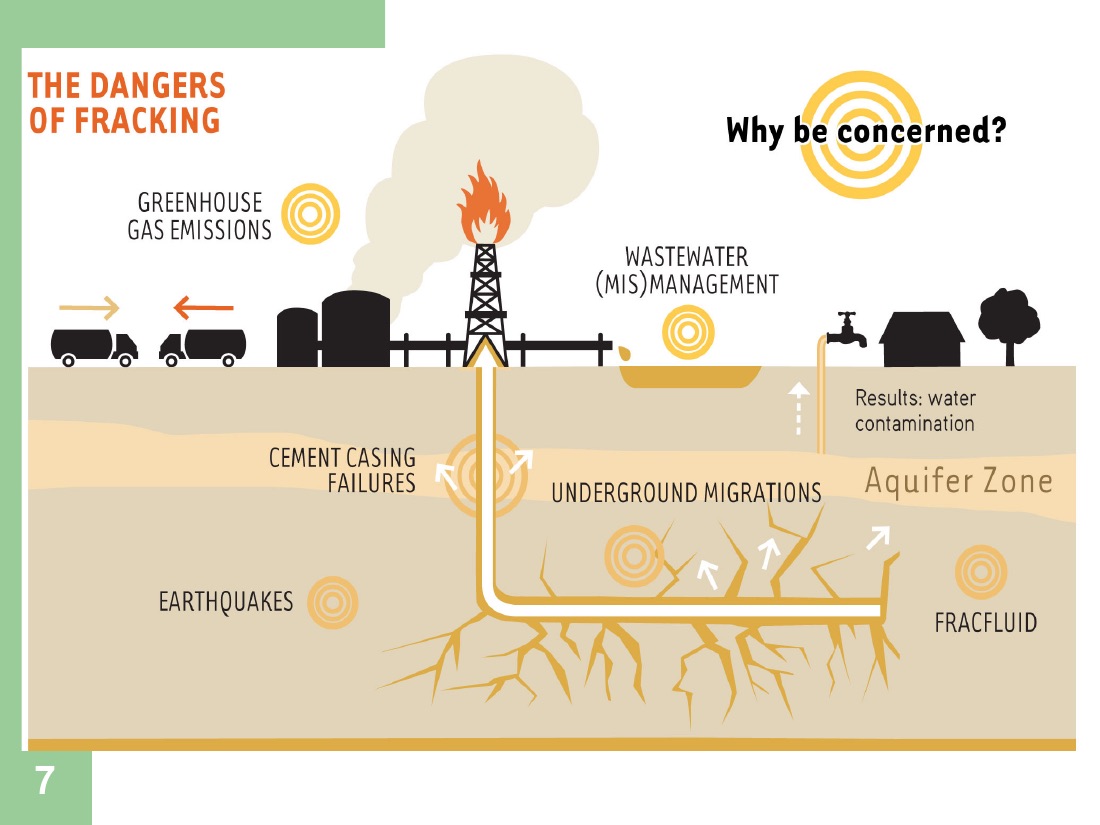
Fracking — hydraulic fracturing
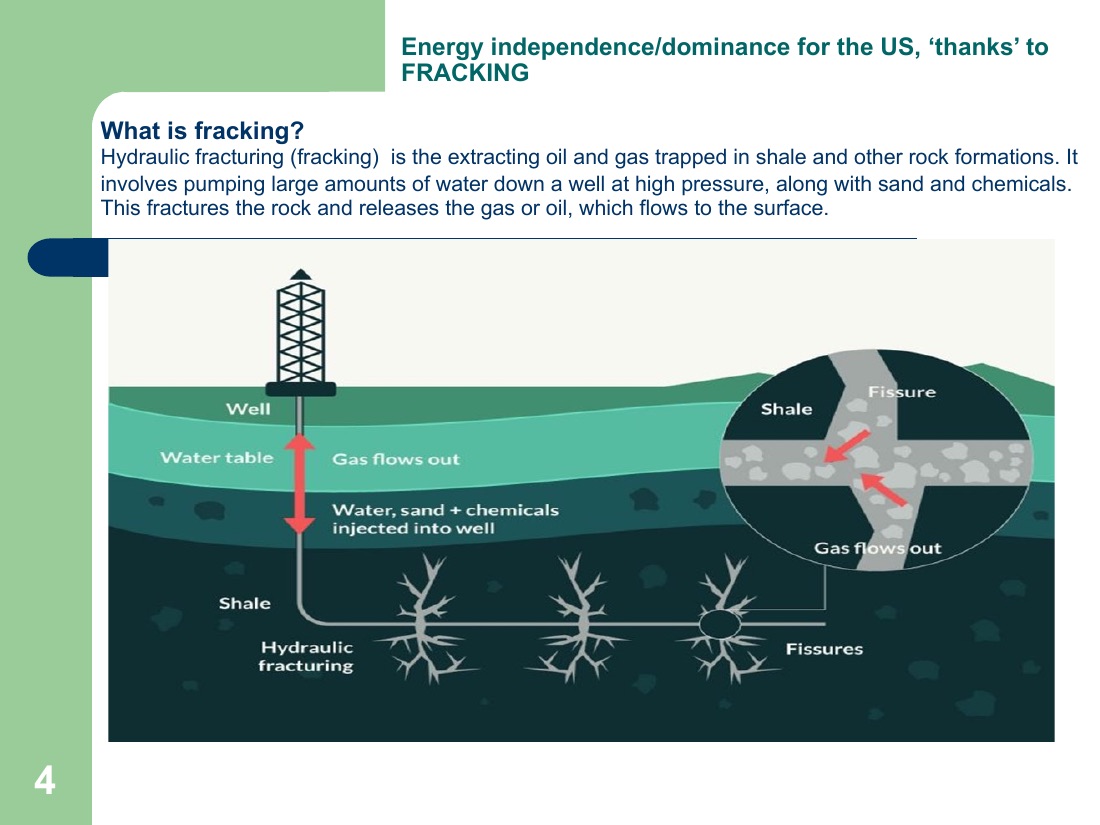
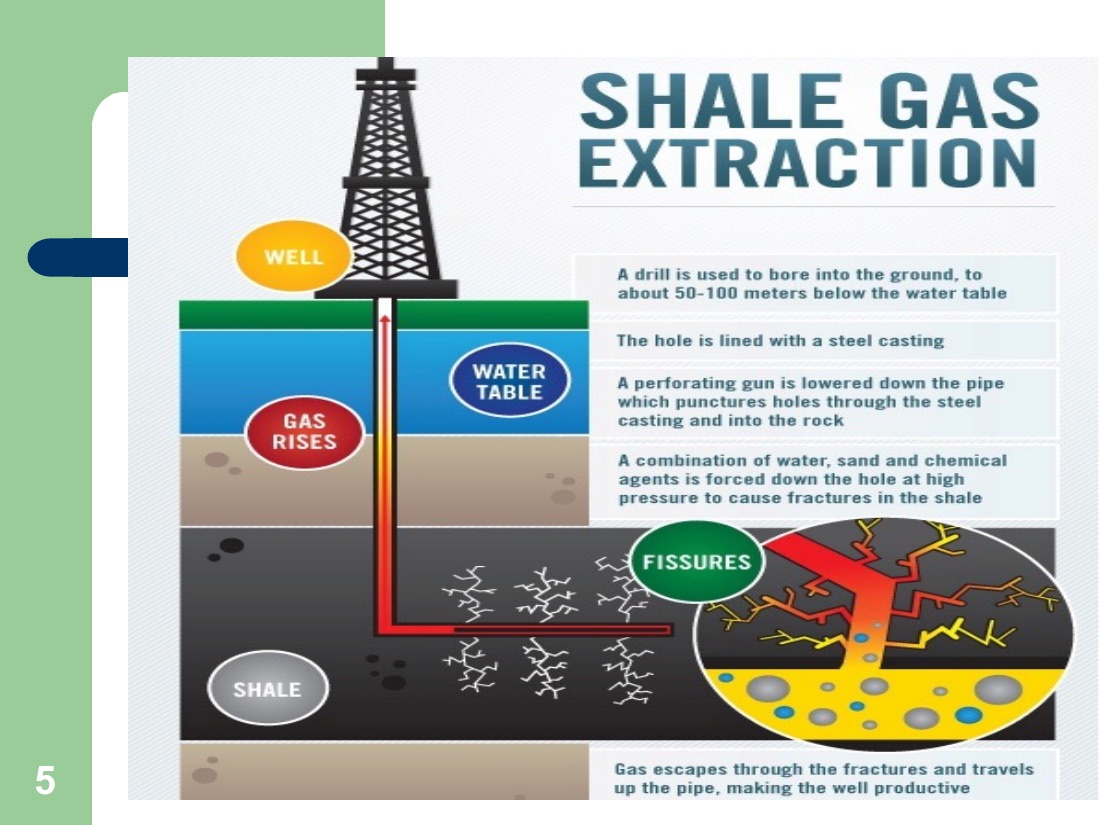
Fracking extracts oil and gas trapped in shale and other rock formations by pumping water + sand + chemicals down a well at high pressure. The high pressure fractures the rock, releasing gas/oil that flows back up.
Made the US "energy independent" / "dominant" — but with side effects:
- May trigger earthquakes (high pressures + on-site wastewater storage)
- Groundwater contamination concerns (chemicals + methane migration)
- Methane leaks from extraction add to GHG burden
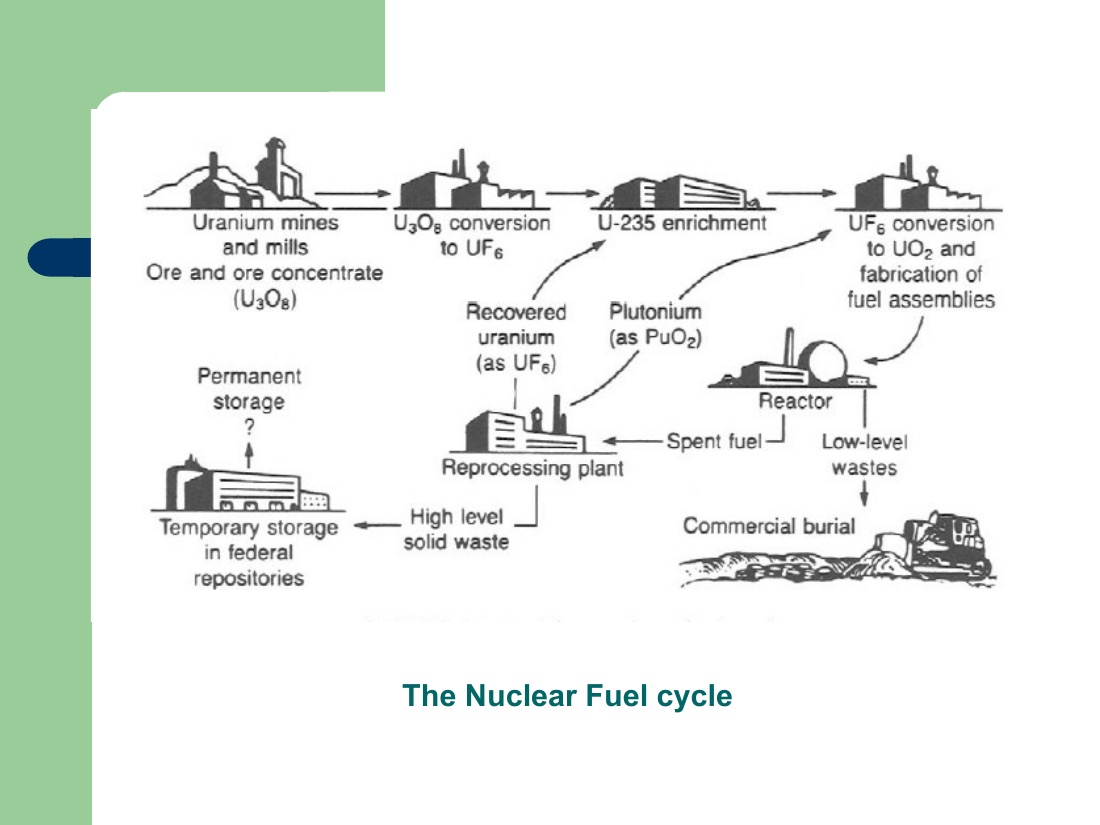
Nuclear (Uranium-235)
Non-renewable, but vast deposits exist (e.g. Australia). 1 kg of uranium oxide produces heat equivalent to ~16 metric tonnes (16,000 kg) of coal — phenomenal energy density.
Concerns
- Enrichment produces toxic waste
- Spent rods (highly radioactive) currently stored in deep caves and mines
- Nuclear plants are delicate (unstable) — major accidents:
- 1979 · Three Mile Island, Pennsylvania, USA
- 1986 · Chernobyl, Ukraine (then USSR)
- 2011 · Fukushima Daiichi, Japan
- Nuclear weapons proliferation, especially in politically unstable regions
Sustainable option 1 — Energy efficiency
Meeting demand with dwindling supply — getting more from less.
- Conservation — LED & fluorescent bulbs replace incandescents; switch off lights/AC when leaving; walk / bike / bus / carpool; natural lighting & ventilation; solar panels / inverters instead of generators; use less water.
- Increased equipment efficiency — better designs that yield more useful output per unit input.
- Cogeneration (CHP) — capture and use waste heat instead of releasing it to the atmosphere.
Sustainable option 2 — Alternative (renewable) sources
- Biofuel — fuel from biomass
- Biomass — organic matter directly
- Geothermal — hot rock formations to produce heat
- Hydroelectric — energy in falling water
- Solar — electromagnetic radiation from the sun
- Tidal — rise & fall of sea level
- Wave — ocean surface waves
- Wind — kinetic energy of moving air
The reality check
Despite all alternatives, fossil fuels still provide ~70 % of global electrical power and ~95 % of total energy demand (heating, transport, electricity). They will likely remain dominant for some decades. The question is not whether we use them — it's how quickly we can shift, and how well we control emissions while doing so.
Energy & the environment — closing thought
Energy production and consumption are tightly coupled to environmental outcomes. Burning fossil fuels releases GHGs that drive global warming and climate change; it also creates air and water pollution that affects human health and ecosystems.
Renewables offer cleaner alternatives but they are not zero-impact: hydro disrupts river ecosystems and displaces communities; solar farms occupy land; wind turbines kill birds and bats. The challenge is balance — energy needs vs environmental protection, ramping up alternatives faster than fossil dependence reduces them.
📑 Slide gallery — fracking + nuclear from the PDF
Air Pollution Legislation
The 700-year story in one sentence
In 1306, Edward I of England banned the burning of sea coal (soft coal) in craftsmen’s furnaces — the earliest recorded air-quality law. The complaint then wasn’t health, it was smell. Air pollution laws are not new — the recognition that pollution is a health threat, not just a nuisance, is.
As the years passed, air pollution got worse, and yet it was still not widely recognized as a threat to human health — not until the problem reached crisis proportions (London 1952, ~4,700 deaths).
What every air pollution law contains — the two pillars
Every legislative framework, anywhere in the world, has the same two components:
- Emission standards — numerical limits on what may be released. Set after the air-quality criteria are established.
- Abatement strategy — the technological framework to actually control pollution. Choice depends on the nature of the pollutant.
Quote from the slides: “Air quality criteria are the levels of pollution and lengths of exposure above which adverse health and welfare effects may occur; they must be set before standards can be determined.”
The 6 US-EPA criteria pollutants
Set by the Clean Air Act and revised over time. Memorise this list — it’s the foundation:
- CO — Carbon Monoxide
- Pb — Lead
- NOx — Nitrogen Oxides
- PM — Particulate Matter (PM10 and PM2.5)
- SO2 — Sulphur Dioxide
- O3 — Ozone (the photochemical smog culprit)
Mnemonic: “Cops Lead Now to Particle SOaked Ozone” → CO, Pb, NOx, PM, SO2, O3.
Primary vs Secondary standards
- Primary standards — protect human health. The non-negotiable floor.
- Secondary standards — protect welfare: crops, visibility, materials (rust on monuments), wildlife.
A pollutant level might satisfy the primary but fail the secondary — meaning humans are technically safe but ecosystems and infrastructure are still being damaged.
WHO got stricter in 2021 — by how much?
The World Health Organization revised its Air Quality Guidelines in 2021 based on new epidemiology — far harsher than the 2005 numbers most national laws were modelled on. The gap matters: 97% of the world’s population breathes air above the 2021 PM2.5 guideline.
| Pollutant | WHO 2005 | WHO 2021 | Change |
|---|---|---|---|
| PM2.5 · annual | 10 μg/m³ | 5 μg/m³ | −50% |
| PM10 · annual | 20 μg/m³ | 15 μg/m³ | −25% |
| NO2 · annual | 40 μg/m³ | 10 μg/m³ | −75% |
| O3 · 8-hour peak season | — | 60 μg/m³ (new) | added |
| CO · 24-hour | — | 4 mg/m³ (new) | added |
The regulatory acronym zoo — 3 jurisdictions compared
| Jurisdiction | Standards instrument | Abatement-tech criterion | Enforcer |
|---|---|---|---|
| United States | NAAQS (National Ambient Air Quality Standards) · NSPS (New Source Performance) · SIPs (State Implementation Plans) · PSD / NAA | BACT / MACT (Best / Maximum Achievable Control Technology) | EPA + state agencies |
| United Kingdom | Local and EU-derived air-quality objectives | BPM (Best Practicable Means) · BATNEEC (Best Available Technology Not Entailing Excessive Cost) | Environment Agency |
| Nigeria | National Environmental (Air Quality Control) Regulations · National Guidelines and Standards for Environmental Pollution Control | BAPPT (Best Available and Practicably Proven Technology) | NESREA under Federal Ministry of Environment |
Each jurisdiction balances strictness against economic feasibility differently. BATNEEC and BAPPT both bake cost into the technical standard; BACT/MACT lean stricter.
🇳🇬 Nigerian context — what enforcement actually looks like
NESREA (National Environmental Standards and Regulations Enforcement Agency, est. 2007) is the body that enforces environmental law in Nigeria. It replaced the older FEPA (1988) and sits under the Federal Ministry of Environment. Three main instruments matter:
- National Environmental (Air Quality Control) Regulations — emission limits by source category.
- National Policy on the Environment — the umbrella framework; emphasises prevention and sustainable development.
- National Guidelines and Standards for Environmental Pollution Control — concrete limits + government/industry/individual responsibilities.
The catch — the lecturer’s exact slide phrasing:
“Despite these regulations, Nigeria faces significant challenges in enforcing environmental laws and reducing air pollution.” Sources include industrial emissions, vehicular emissions, open burning of waste, and generator use due to unreliable electricity supply.
Legislation as a continuous loop, not a one-off act
The slides put this as a flowchart — useful conceptual frame:
- Measure ambient air against standards.
- If not compliant → compute emission reductions needed, enforce them, loop back.
- If compliant → predict future quality accounting for economic / population growth.
- If future projection is acceptable → stop. Otherwise → compute future controls, enforce, loop.
The point: protecting the environment through legislation is a continuous process, not a single act that gets passed and forgotten.
Methods of Air Pollution Control
The hierarchy — and why source reduction beats end-of-pipe
The lecturer’s mantra: “Source reduction trumps end-of-pipe.” The four-tier hierarchy, in order of preference:
- Source reduction — modify the process to generate less pollutant. Flue Gas Recirculation (FGR), staged combustion, fuel substitution. Cheapest in the long run.
- Recycling / recovery — regenerative adsorption, CHP energy recovery, solvent reclaim.
- End-of-pipe treatment — absorption, adsorption, incineration, scrubbing, filtration. What this module spends most time on.
- Dispersion / atmospheric dilution — last resort. Tall stacks. “Atmospheric dispersion is not a treatment.”
Part 1 · Source modification & gaseous-pollutant treatment
NOx reduction at source
- Flue Gas Recirculation (FGR) — recycle ~20–30% of cooled flue gas back into the combustion zone. Lowers peak flame temperature AND dilutes available O₂. Cuts thermal-NOx formation 30–60%.
- Staged combustion — fuel-rich primary zone (low O₂, less NOx) then secondary zone (excess air, completes combustion). Suitable for retrofit.
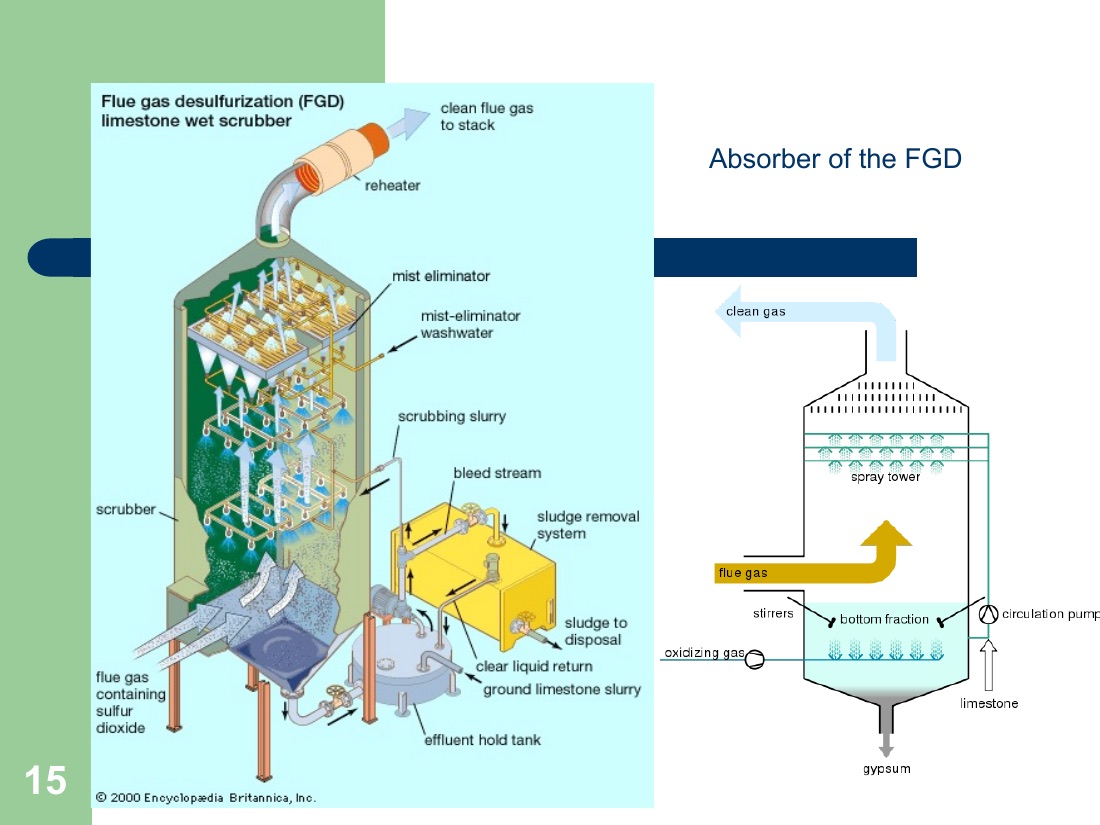
SO2 control — Flue Gas Desulphurisation (FGD)
Limestone slurry spray reacts with SO₂: CaCO₃ + SO₂ + ½O₂ → CaSO₄ + CO₂. Produces saleable gypsum. Removal efficiency 90–99%. L/G ratio 1–4 L per m³ of gas.
End-of-pipe gaseous treatment — the toolkit
| Method | Mechanism | Best for | Efficiency |
|---|---|---|---|
| Absorption (packed tower, venturi) | Soluble gas dissolves into a liquid film | SO₂, NH₃, HCl, soluble VOCs | 80–98% |
| Adsorption (activated carbon, silica gel) | Molecules stick to solid surface (van der Waals) | VOCs, odours, solvent recovery | 80–95% |
| Condensation | Cool gas below dew point of contaminant | High-concentration VOCs & solvents | 50–95% |
| Biofiltration | Microbes on a moist medium oxidise the gas | Odours, low-concentration VOCs | 60–95% |
Part 2 · Combustion treatment — the 3Ts principle
To destroy VOCs by thermal oxidation, all three Ts must be met simultaneously — fail any one and destruction efficiency collapses:
- Time — residence time τ = V / Q. Design range 0.2–0.6 sec.
- Temperature — chamber 375–825 °C; ~700 °C typical for VOCs, ~800 °C for 99% destruction.
- Turbulence — swirlers, baffles. Without it, plug flow leaves dead zones with unreacted pollutant.
Thermal vs Catalytic
- Thermal incineration — 700–800 °C, no catalyst. Reliable but fuel-hungry.
- Catalytic incineration — Pt or Pd on alumina/ceramic. 375–500 °C. ~30% energy savings. Catalyst poisoned by Pb, S, Cl.
- Cogeneration / CHP — recover exhaust heat for steam/power. Overall efficiency ~80%.
Part 3 · Particulate control — the 5 conventional devices
| Device | Mechanism | Particle size | Efficiency | ΔP (Pa) | Best when |
|---|---|---|---|---|---|
| Gravity settler | Gravitational settling | > 100 μm | 50–70% | minimal | Pretreatment only — cheap first stage. |
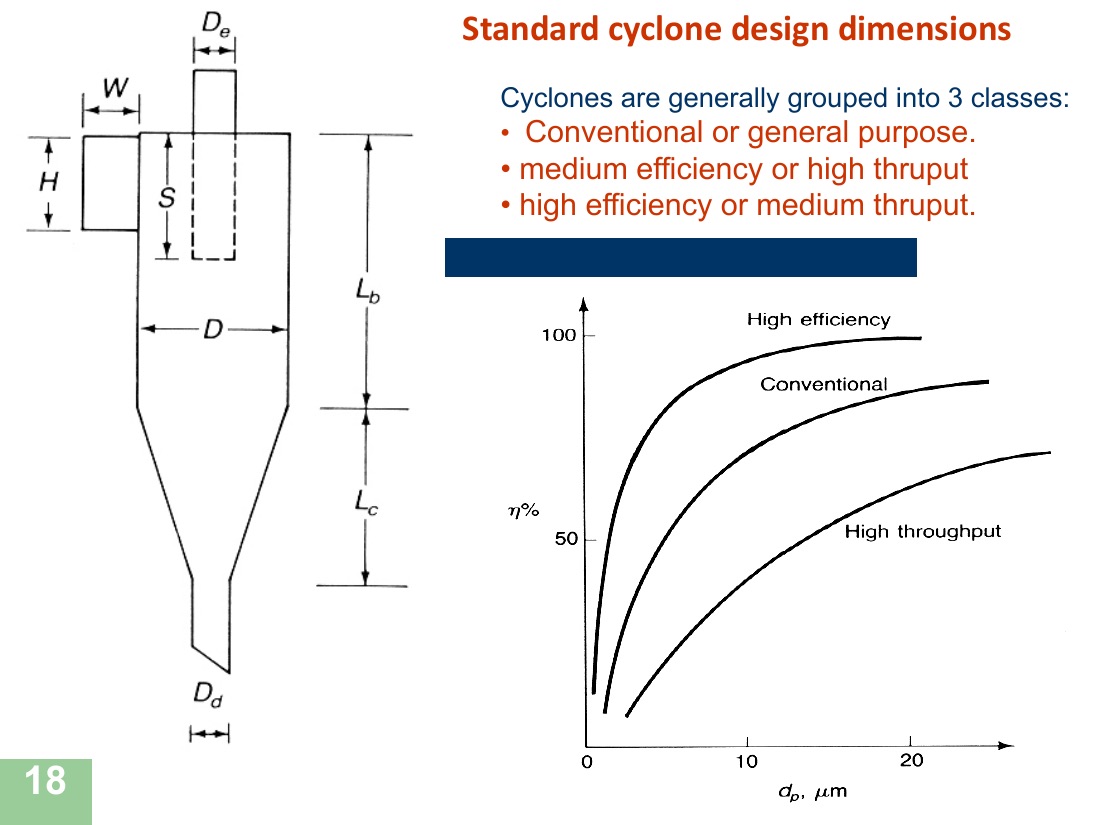
| Cyclone | Centrifugal force (no moving parts) | > 5 μm | 50–95% | 250–1 250 | Dry recovery, no liquid waste; rugged. |
| Venturi scrubber | Inertial impaction on water droplets | 2–50 μm | 80–99% | 500–2 500 | Hot, sticky, or soluble-gas streams. |
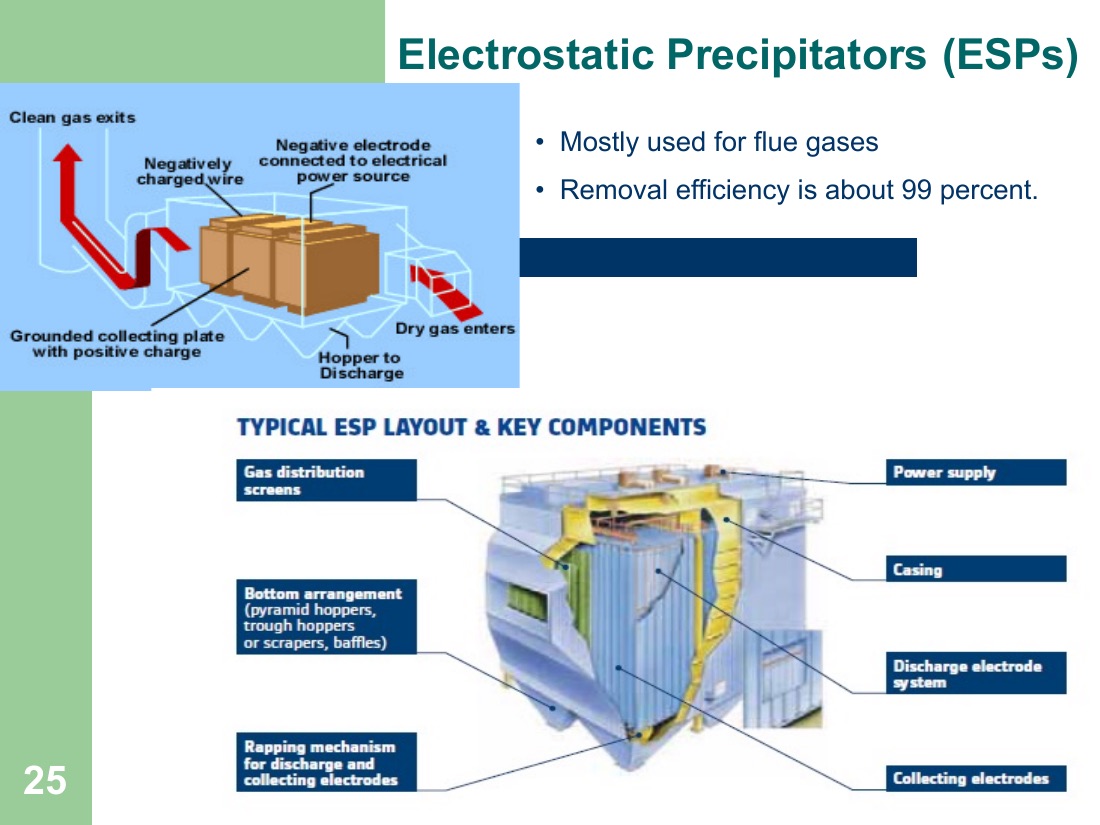
| ESP | Electrostatic attraction at > 50 kV corona | 0.1–100 μm | 95–99% | < 125 | Huge flows (power-plant fly ash). Low ΔP. |
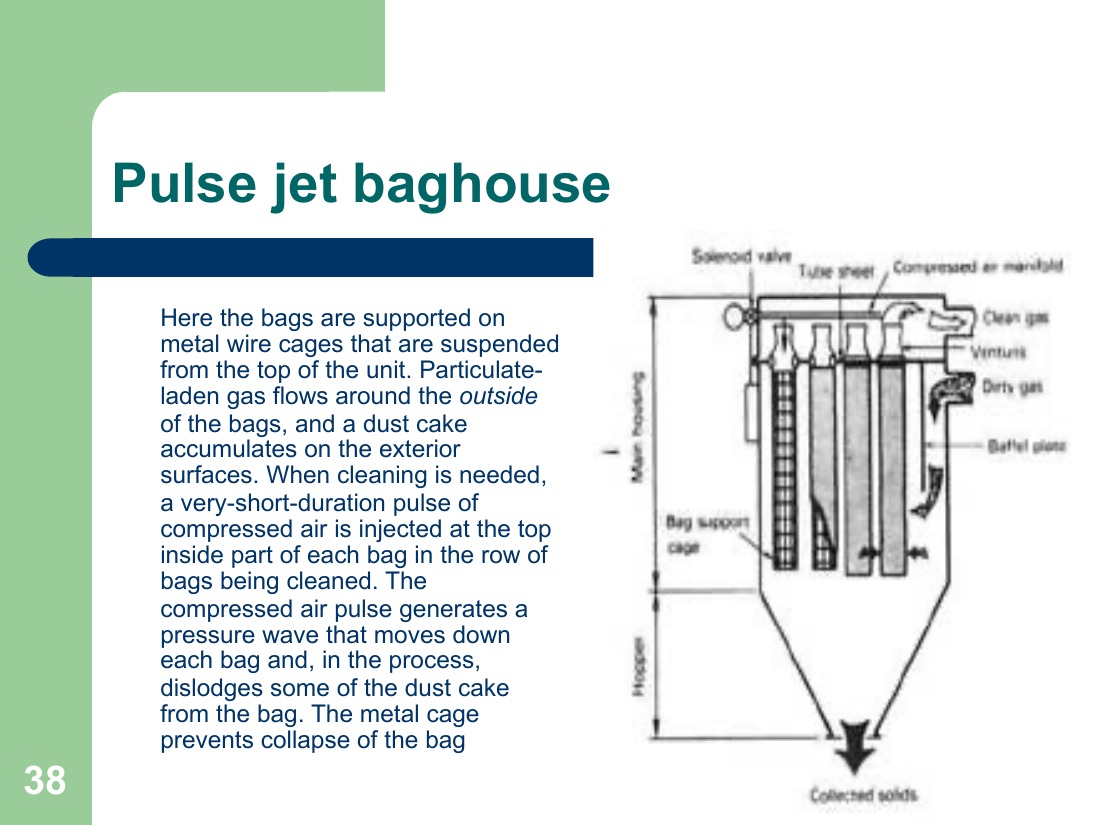
| Fabric filter (baghouse) | Sieving + cake on woven cloth | > 0.1 μm | 99.9% | 300–1 000 | Highest efficiency. Cement, metals industry. |
Key design tools: Johnstone equation for venturi efficiency, Lapple cut-diameter d50 for cyclones, drift velocity for ESPs, air-to-cloth ratio for baghouses.
Part 4 · Dispersion — when the air itself is your last line of defence
Once exhaust leaves the stack, atmospheric stability and wind decide what arrives at ground level. The single most important number:
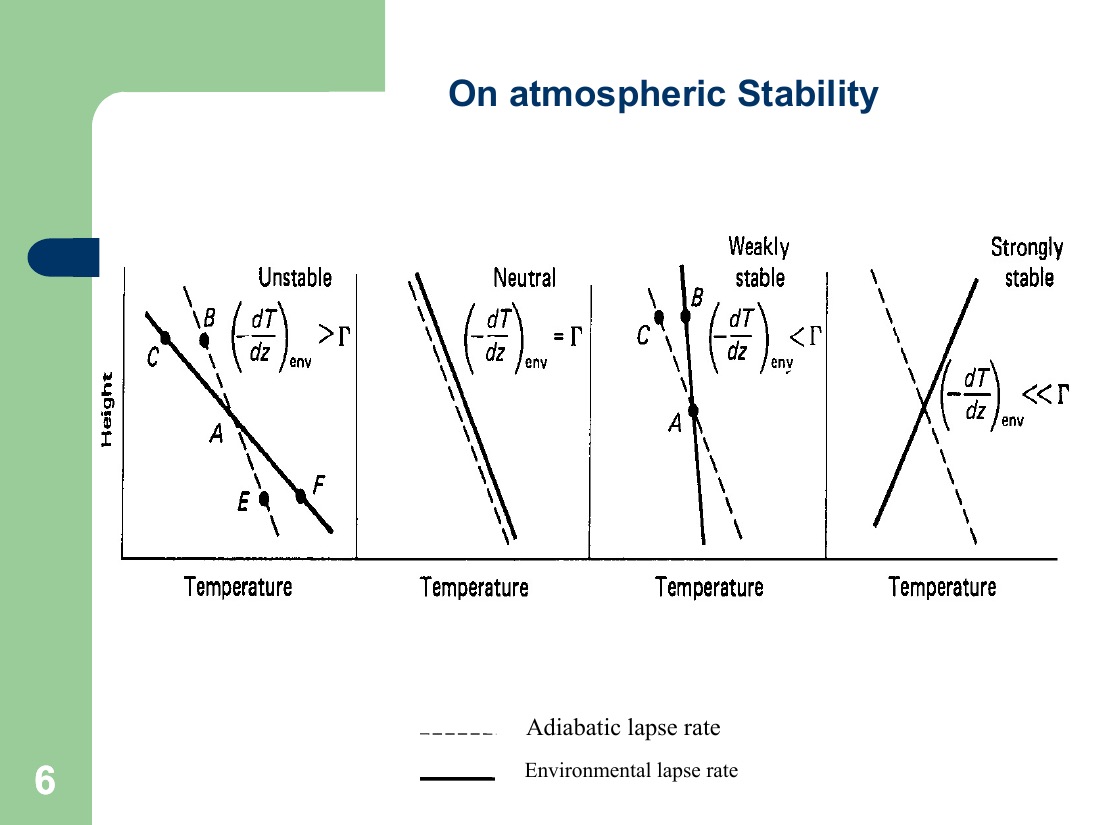
Dry adiabatic lapse rate ≈ −10 °C / km
If the actual atmospheric lapse rate is greater than −10 °C/km → unstable (good mixing). Equal → neutral. Less than → stable (poor mixing, even inversion, where T rises with height).
Stability + wind speed produce six classic plume shapes — and the worst-case for ground-level pollution is fumigation: an elevated plume that hits an inversion above and gets pushed down into a layer that won’t let it escape upward.
The two formulas worth memorising
Briggs’ plume rise (unstable/neutral)
Δh = 1.6 · F1/3 · x2/3 / u
where F = buoyancy flux ≈ g · Q · ΔT / Ta, x = downwind distance, u = wind speed at stack height. Effective stack height = physical height + Δh.
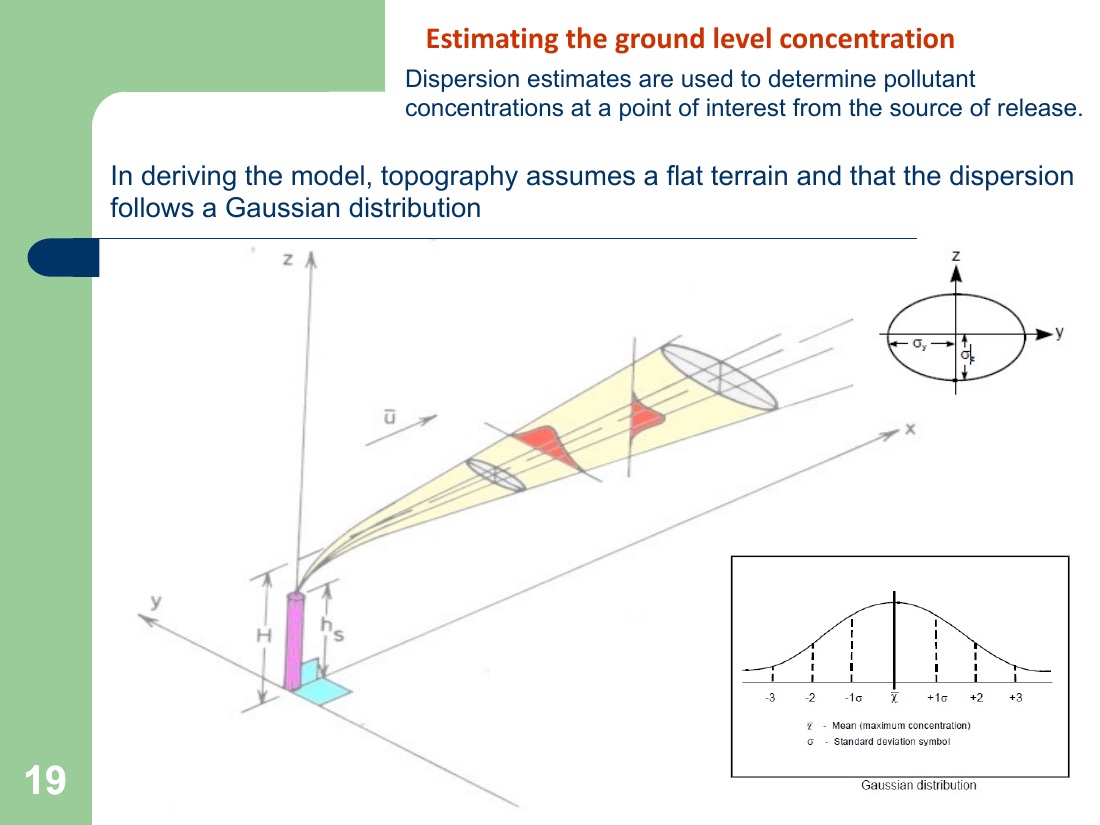
Gaussian plume (centreline, ground-level concentration)
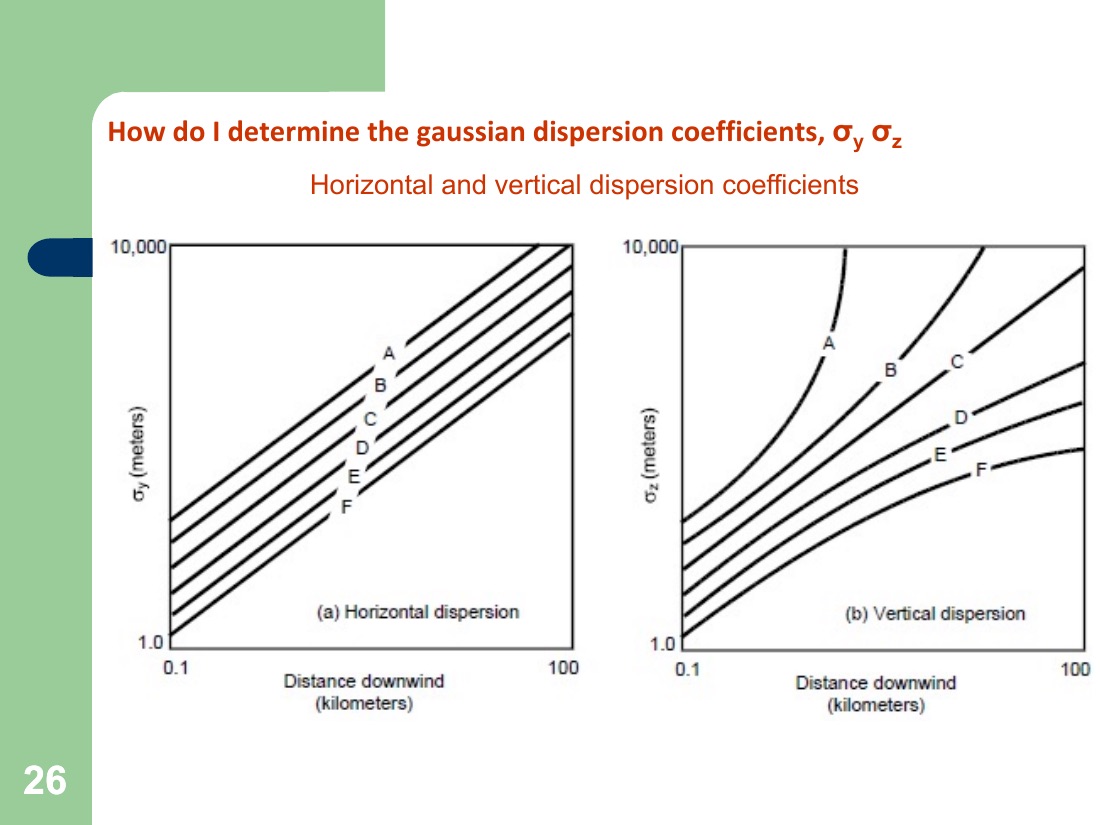
C(x, 0, 0) = Q / (π · σy · σz · u) · exp(−h²/2σz²)
where σy, σz grow with downwind distance and depend on stability class. The maximum ground-level concentration typically occurs at x ≈ 5–15 km from the source.
🇳🇬 Lagos-context callouts from the slides
- Water availability matters for device choice — wet scrubbers viable on Lagos coast, but inland/Sahel installations should lean dry (cyclone, ESP).
- Stable nights → fumigation risk. Industrial plants near residential areas face worst-case dispersion at night and early morning.
- Generator emissions — distributed sources at low stacks pile up under inversion. The control problem is partly an infrastructure problem (grid reliability).
📑 Slide gallery — Module V’s exam-critical figures
Pulled from the lecturer’s 4-part PDF set. These are the diagrams you’ll be expected to identify, label, or reproduce on the exam.
Industrial Wastewater Management
The lecturer’s framing
“Taking decisions on how best to deal with the ‘unwanted’ wastewater so as NOT TO CAUSE HARM to human health and the environment.”
Three strategies, in order of preference:
- Prevention — design the process so wastewater isn’t generated.
- Minimization — reduce volume and toxicity at source.
- Treatment — what the rest of this module covers.
Note: industrial wastewater is “highly variable and depends on the industry” — petroleum refineries put out phenols + hydrocarbons + sulfides; breweries put out carbohydrates + proteins; tanneries put out proteins + sulfides + chromium. No two streams characterise the same way.
The characterisation parameters — what we measure
Physical
- TSS — Total Suspended Solids (filtered out)
- TDS — Total Dissolved Solids
- Turbidity / colour / odour / temperature — higher T means faster microbial metabolism but lower dissolved O₂.
Chemical
- pH · DO (dissolved oxygen)
- BOD₅ · COD · TOC (next card)
- Heavy metals — Cr, Hg, Cd, Pb (case studies follow)
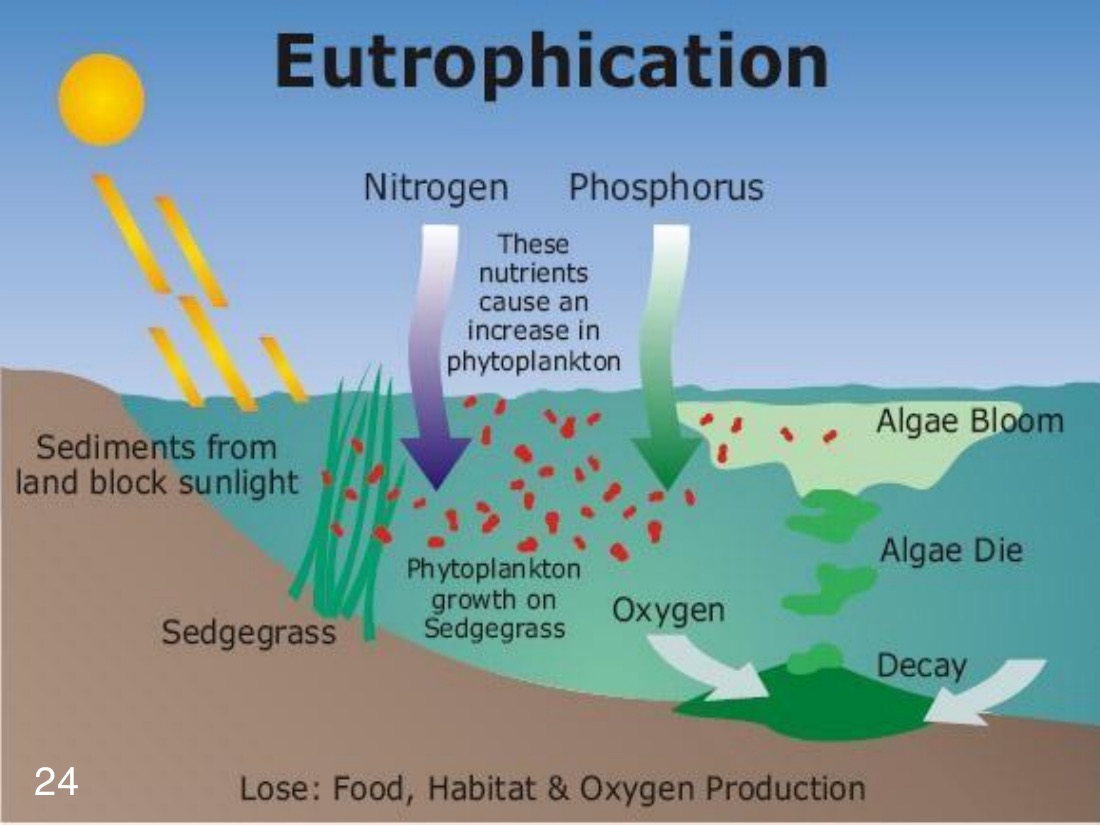
- Nutrients — N (NH₃ → NO₂⁻ → NO₃⁻ nitrification chain), P
BOD vs COD vs TOC — the three demands compared
| Parameter | What it measures | Test method | Speed |
|---|---|---|---|
| BOD₅ (Biochemical Oxygen Demand) | O₂ used by aerobic microbes to oxidise organic matter — biodegradable load only | Incubate sample 5 days at 20 °C, measure dissolved O₂ depletion | 5 days · 60–70% of full oxidation captured |
| COD (Chemical Oxygen Demand) | O₂ needed to chemically oxidise all organics (biodegradable + refractory) | Reflux with K₂Cr₂O₇ in H₂SO₄, Ag₂SO₄ catalyst, 2 h | ~2 hours · ≥ BOD always |
| TOC (Total Organic Carbon) | Carbon content of organics | Catalytic combustion to CO₂, measured by IR | Minutes · independent of oxidation state |
Key relation: (COD − BOD) ≈ non-biodegradable organic matter. BOD itself splits into two stages: CBOD (carbonaceous, first ~5–10 days) + NBOD (nitrogenous, nitrification — kicks in later).
BOD kinetics is first-order: BODt = BODu · (1 − e−kt), with typical k ≈ 0.23 / day at 20 °C. So BOD₅ ≈ 68% of BODu.
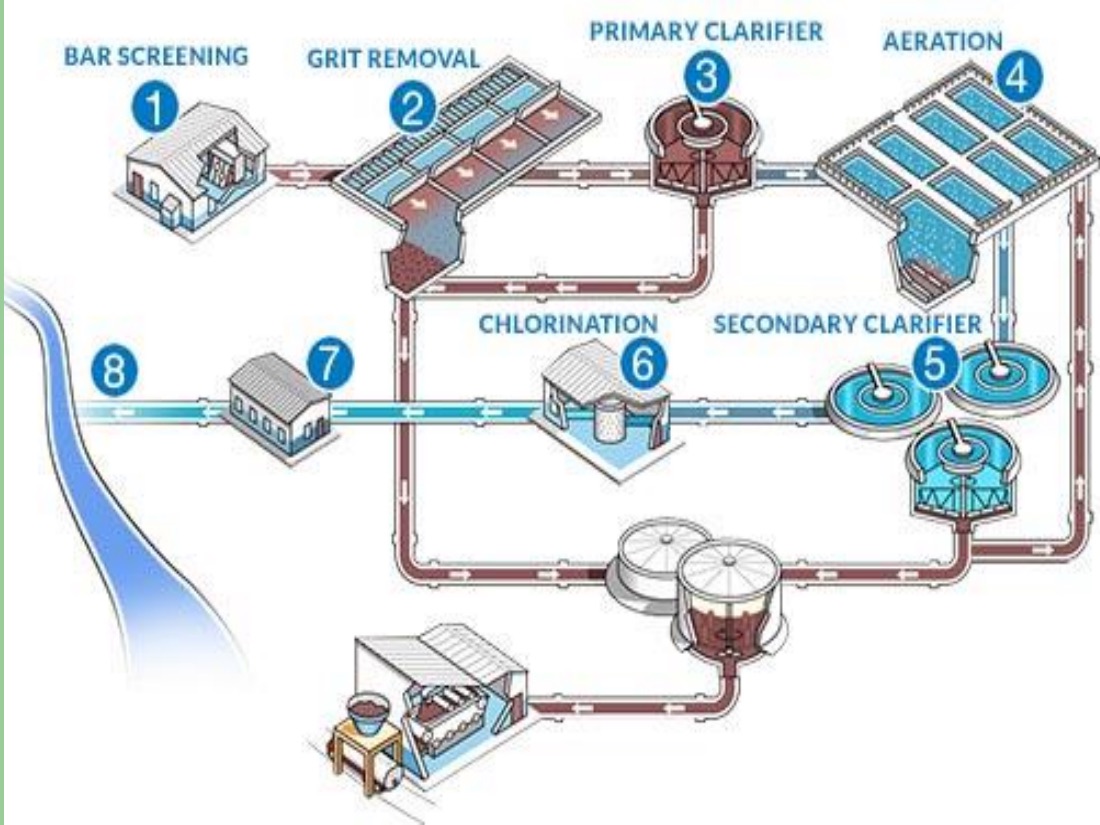
The treatment train — preliminary to advanced
| Stage | What it does | Typical removal | Example equipment |
|---|---|---|---|
| Preliminary | Physical removal of gross solids — rags, plastics, sand, grit. Protects pumps and pipes. | — | Bar screens · grit chambers |
| Primary | Gravity sedimentation in a clarifier. | ~30% BOD · ~60% TSS | Primary clarifier · Imhoff tank |
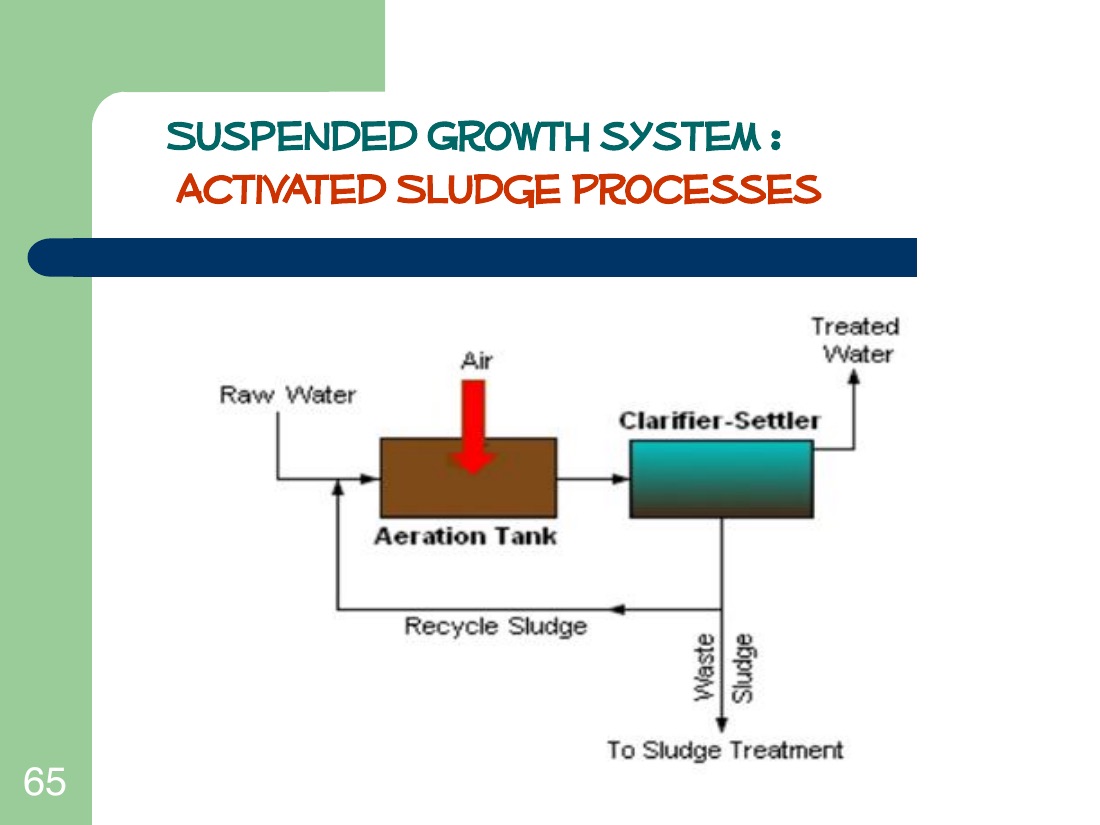
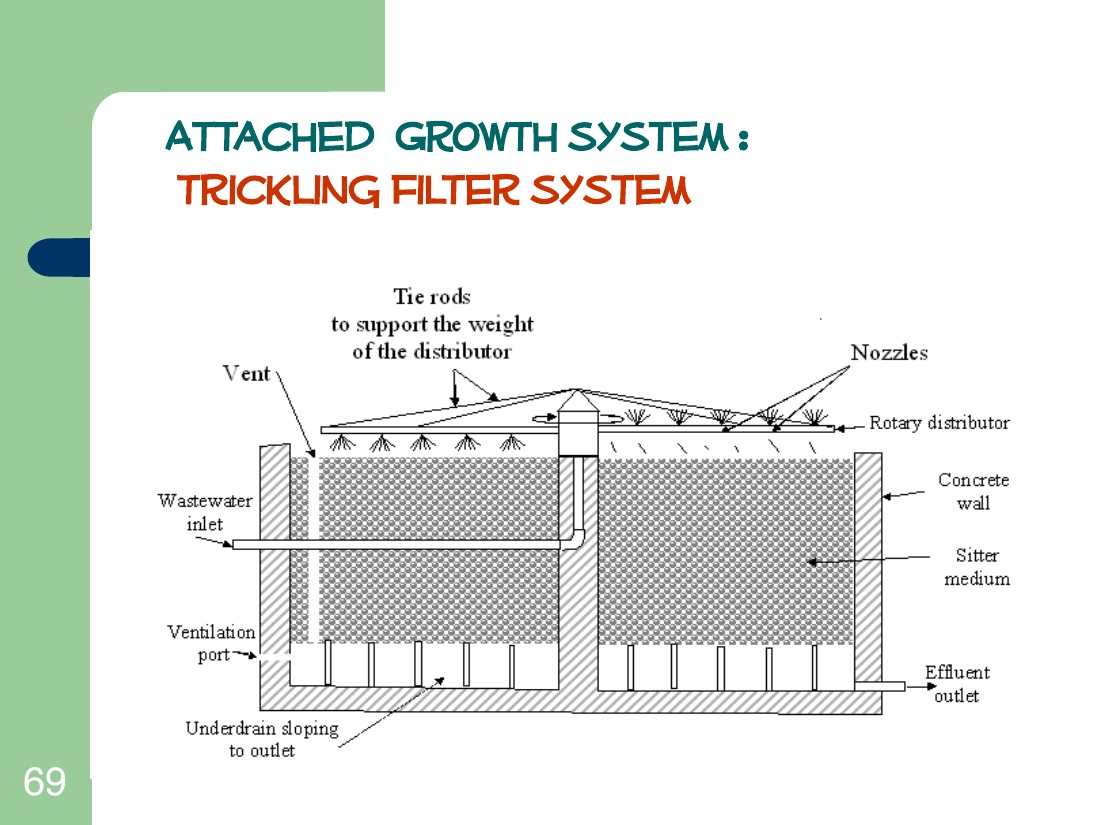
| Secondary | Biological — aerobic microbes oxidise dissolved organics. | 85–95% BOD | Activated sludge · trickling filter · MBBR |
| Tertiary | Polishing: filtration, disinfection, nutrient removal. | Final BOD polish · pathogens · N & P | Sand filter · UV / chlorination · ion exchange |
| Advanced | Recalcitrant pollutants, full nutrient removal. | Trace organics · pharmaceuticals | MBR · AOPs (O₃/H₂O₂, UV/H₂O₂, photo-Fenton) · constructed wetlands |
Heavy-metal case histories — why this all matters
- Chromium — leaks from compressor cooling and electroplating. Hexavalent Cr (the “Erin Brockovich” pollutant) is carcinogenic.
- Mercury — Minamata Bay (Japan, 1956) — methylmercury accumulated in fish from an acetaldehyde catalyst process, causing severe neurological disease.
- Cadmium — itai-itai disease in Japan from rice fields irrigated with mining wastewater; brittle-bone syndrome.
Three different metals, three different chronic, devastating syndromes. The lecturer’s point: you cannot remediate after the fact — pre-discharge treatment is the only viable strategy.
📑 Slide gallery — Module VI
Solid Waste Management
What makes solid waste different
“These wastes remain at the point of origin until a decision is made to collect and dispose of them.”
Unlike air or water pollutants, solid waste doesn’t flow away — it accumulates. That gives the engineer a window: every kilogram is a discrete decision about how to handle it.
The five waste classes
- MSW · Municipal Solid Waste — household + commercial; in Nigeria roughly ~50% organic by mass, and the share is rising with urbanisation.
- Industrial waste — manufacturing by-products; highly variable by sector.
- Hazardous waste — toxic, corrosive, reactive, ignitable; needs special handling and licensed disposal.
- E-waste — discarded electronics. Carries Pb, Hg, Cd, brominated flame retardants and valuable Au, Cu, rare earths.
- Biomedical waste — hospital/healthcare sources; sharps, pathological, pharmaceutical.
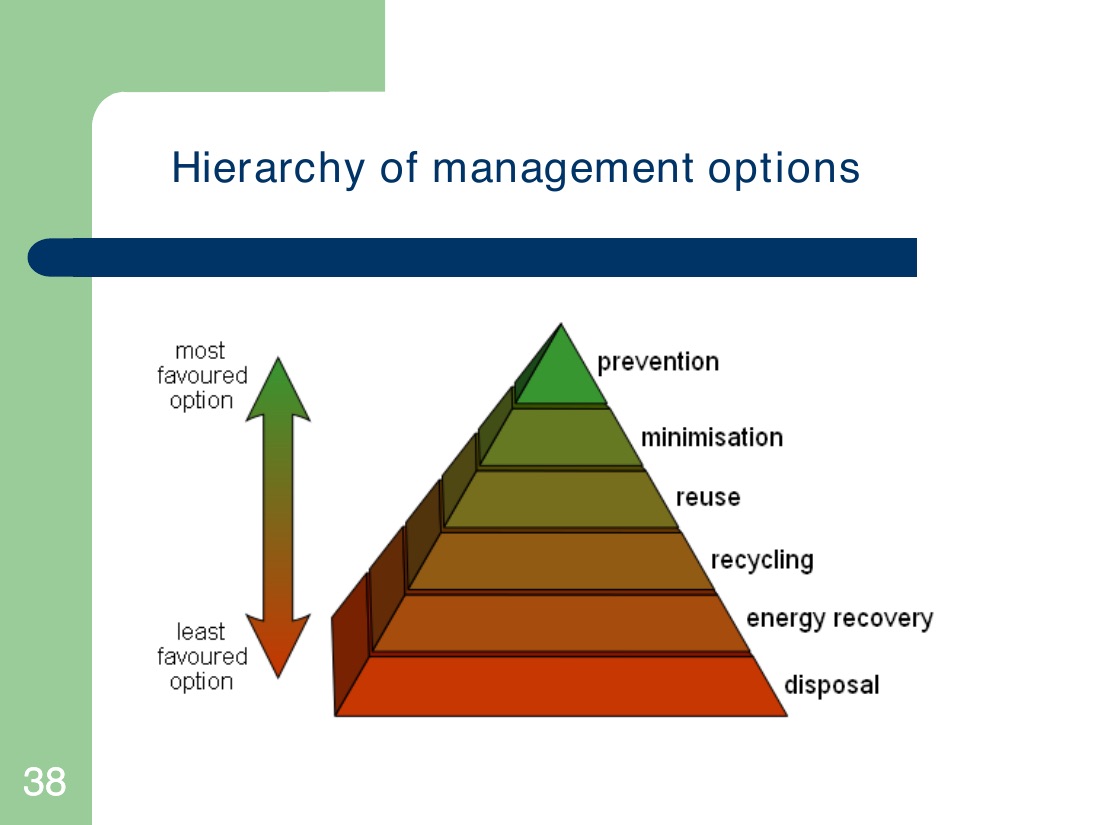
The 5-tier waste hierarchy (the lecturer’s exact order)
- Reduce — minimise waste generation at source.
- Reuse — extend product life as-is.
- Recycle — reprocess materials into new feedstock.
- Recover — extract value (energy / biogas / heat).
- Dispose — landfill or incineration without recovery: final resort.
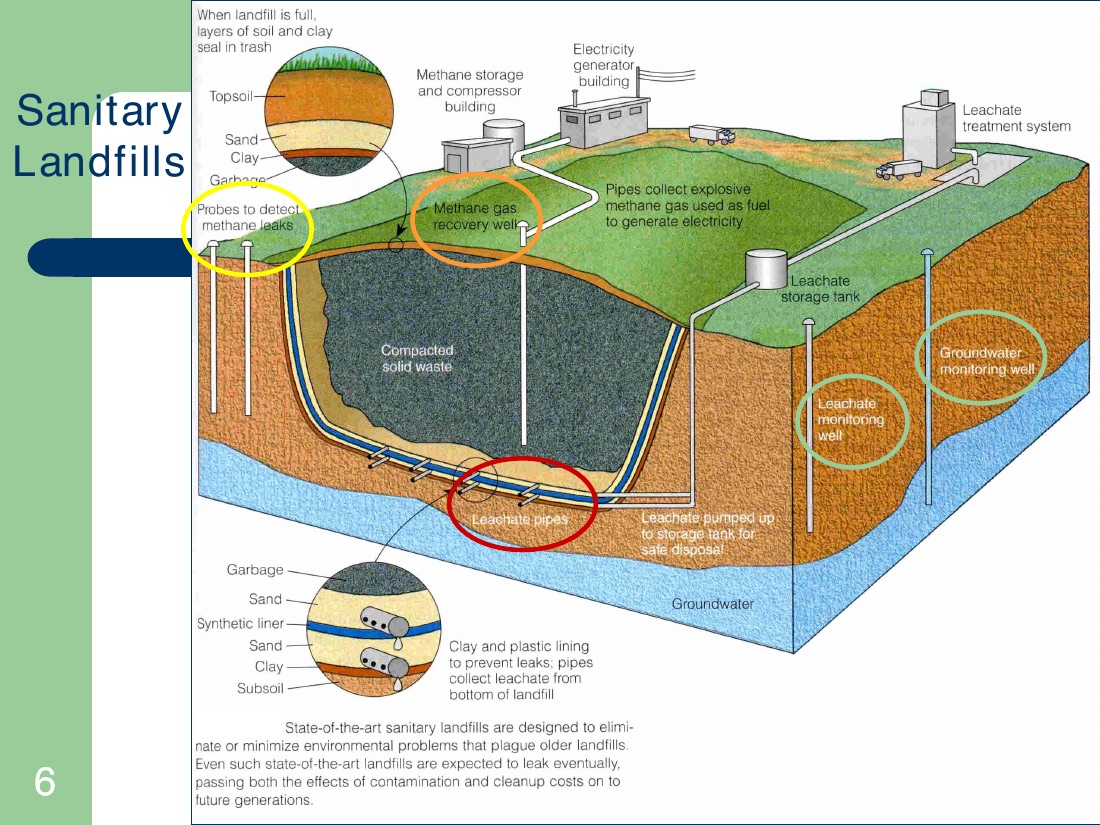
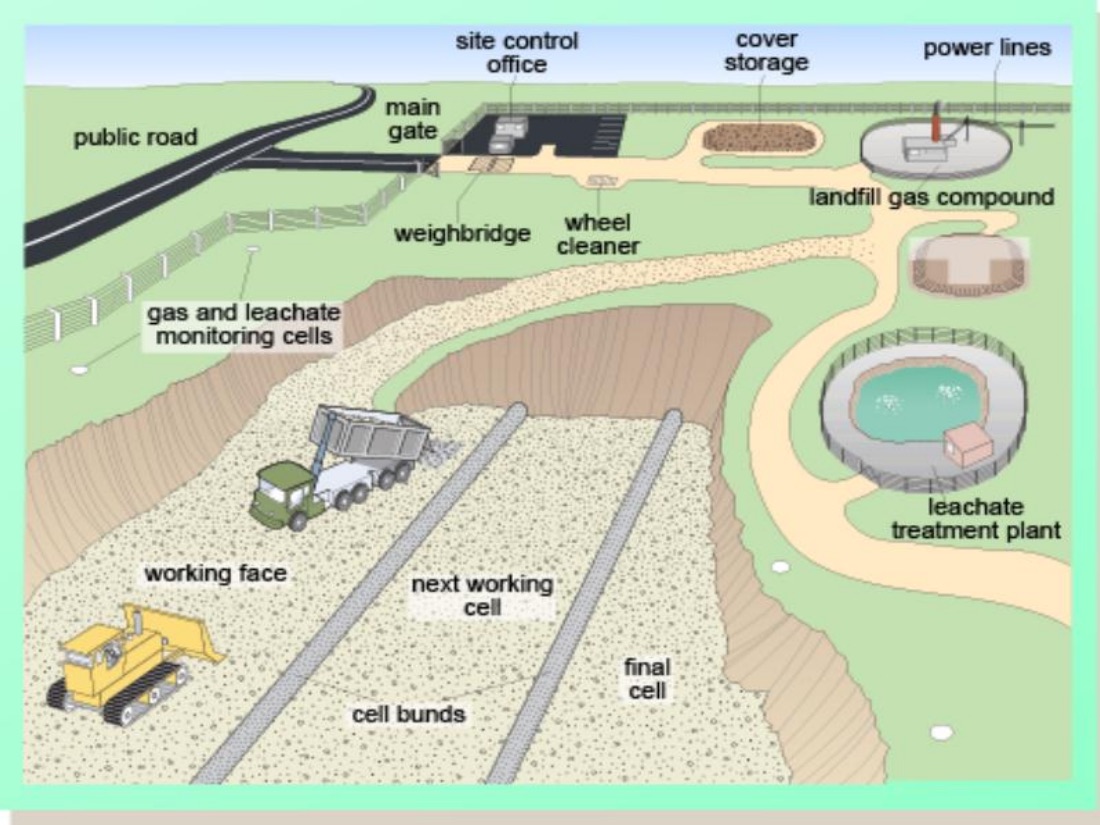
What makes a landfill sanitary
An engineered sanitary landfill has four protection layers between trash and the environment:
- Bottom liner — compacted clay plus HDPE geomembrane (~1.5 mm). Stops leachate seeping into groundwater.
- Leachate collection — perforated pipes above the liner, sloped to a sump and pumped to a storage tank for treatment.
- Gas wells — vertical pipes pull landfill gas off for flaring or beneficial use; probes detect leaks.
- Daily & final cover — six-inch soil cover after each day’s waste; 1 m clay cap when full. Minimises rain ingress and fugitive methane.
Settlement continues for 10–30 years after closure. The site can’t be built on until then.
The 5 phases of landfill gas evolution
| Phase | Duration | Conditions | Composition |
|---|---|---|---|
| 1 · Aerobic | days to weeks | O₂ from buried air consumed by microbes | O₂ ↓, CO₂ rises to ~20% |
| 2 · Anoxic transition | months | Acidogenesis | CO₂ peaks, H₂ rises briefly, no CH₄ yet |
| 3 · Methanogenic start | months–years | Methanogens dominate | CH₄ rising, CO₂ falling |
| 4 · Stable methanogenic | 15–30+ years | Steady anaerobic | CH₄ ≈ 55–60%, CO₂ ≈ 40% |
| 5 · Aerobic re-establishment | after substrate exhausted | O₂ leaks back in | CH₄ drops, CO₂ + N₂ return |
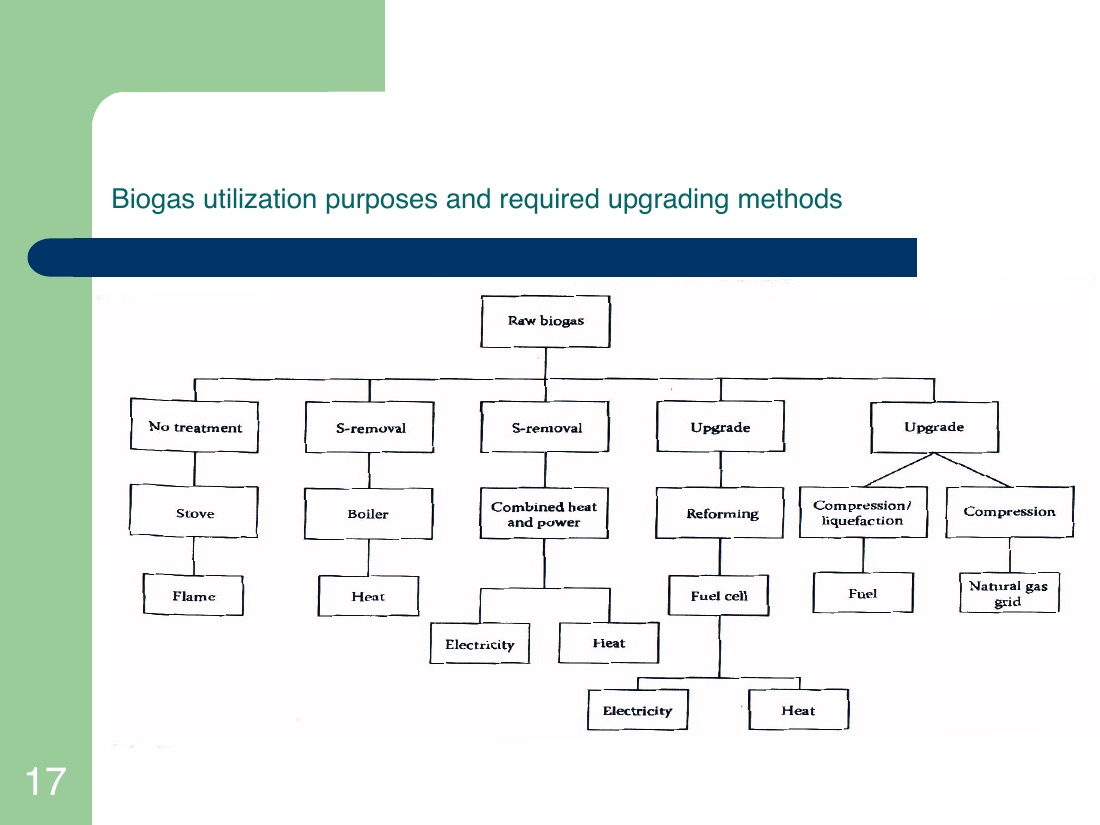
Phase 4 is where the methane comes from. A well-managed landfill captures it for electricity (CHP), boilers, or grid injection after upgrading.
Incineration (WTE), Composting & Anaerobic Digestion
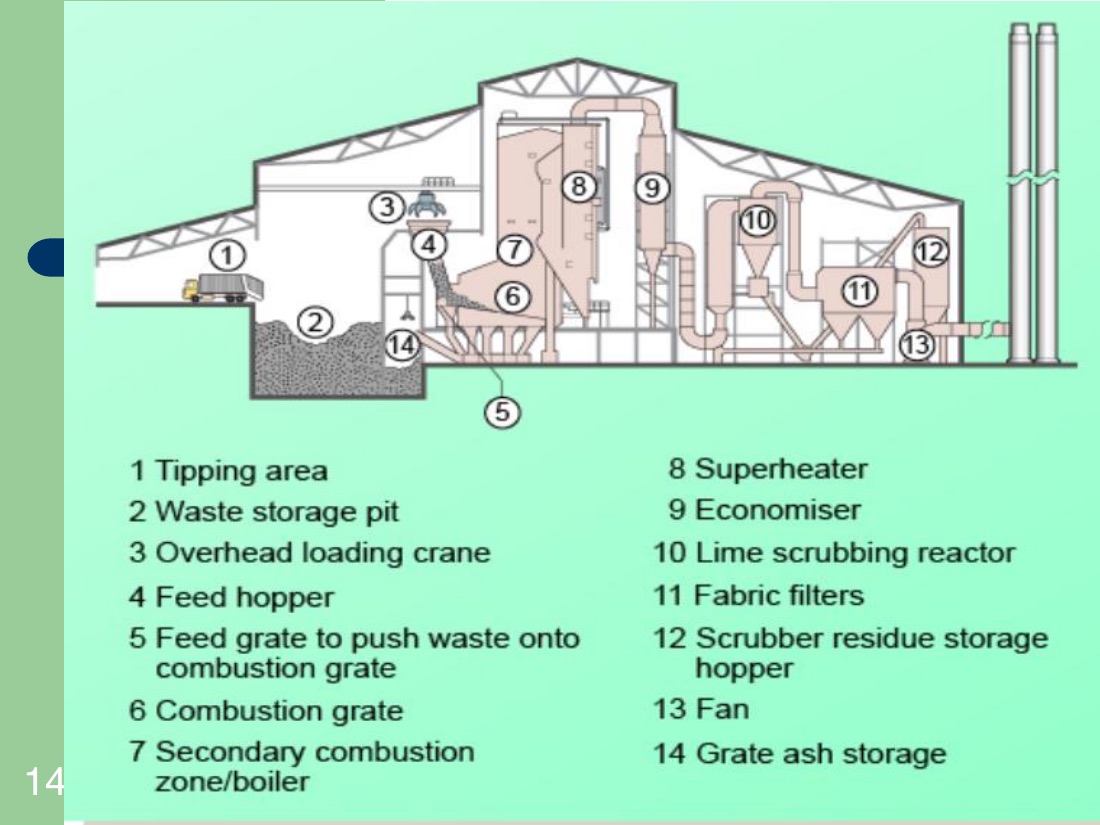
Incineration / Waste-to-Energy
- Temperature 1150–1450 °C; residence time ~2 sec; air supply 1.8–2.5× stoichiometric.
- Reduces waste volume 80–90%.
- Gas cleaning: SNCR with NH₃ converts NOx → N₂; lime + activated carbon scrub SO₂, dioxins, furans.
- Ash residue is toxic — goes to engineered landfill.
Composting vs Anaerobic Digestion
- Composting — aerobic. C:N ~25:1. Produces humus + CO₂ + heat. “Vegetable-to-vegetable” closure of the organic-matter cycle.
- Anaerobic Digestion — oxygen-free. Produces biogas: 55–77% CH₄, plus CO₂, H₂S, NH₃, water. Digestate as fertiliser.
- Biogas upgrading (membrane, cryogenic, PSA, MEA wash) lifts CH₄ > 97% for stove/CHP/grid injection.
📑 Slide gallery — Module VII
Engineering for Sustainable Development
The Brundtland definition — the most-cited sentence in this course
“Development that meets the needs of the present without compromising the ability of future generations to meet their own needs.”
From Our Common Future, the report of the World Commission on Environment and Development (WCED), chaired by Norwegian Prime Minister Gro Harlem Brundtland, published 1987 by the UN through Oxford University Press. It launched “sustainable development” as a policy concept.
The report’s argument: poverty in the developing world is less the cause than the effect of environmental degradation — caused mostly by the consumption of the industrialised world. If all of humanity lived like North Americans, we’d need four planets.
The Triple Bottom Line — the 3 Ps
- People — social equity, working conditions, community impact
- Planet — environmental impact, resource use, emissions
- Profit — economic viability over the long term
All three weighted in decisions — not just financial profit.
The 6 Rs framework
- Rethink · Reduce · Reuse
- Recycle · Recover · Redesign
An extension of the waste hierarchy that puts “rethink” (challenging the need for the product at all) above “reduce”.
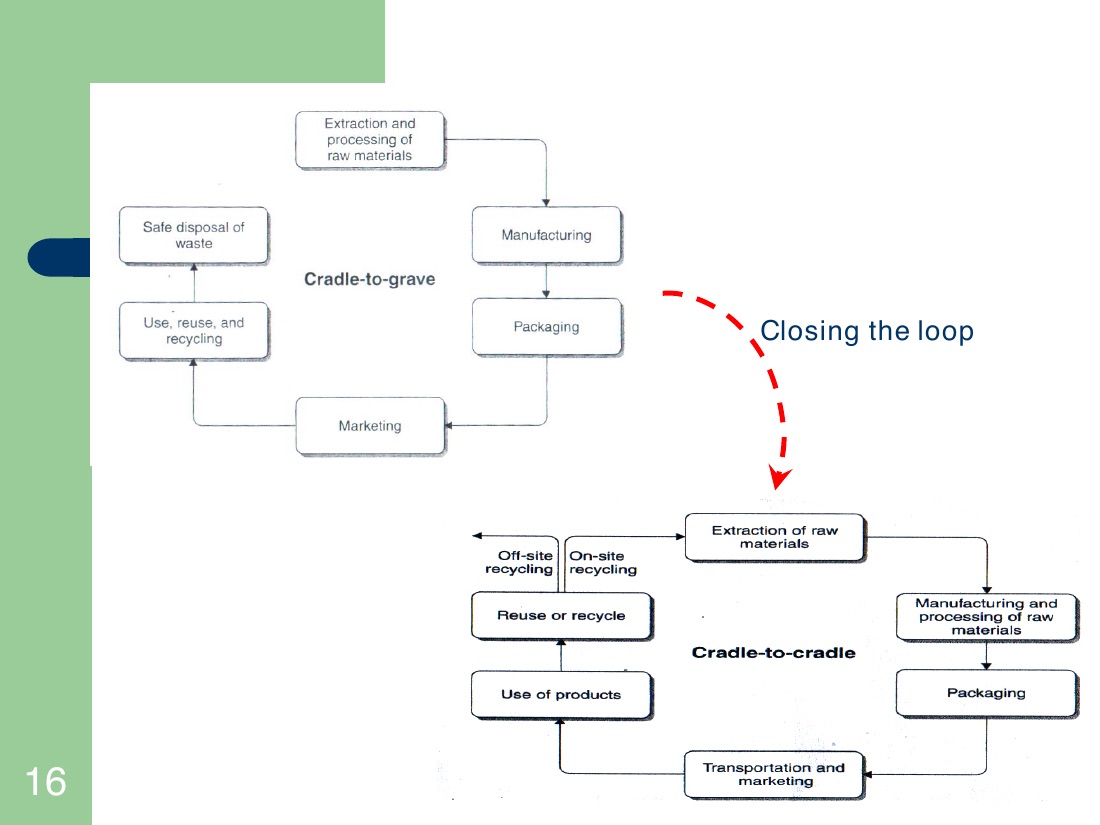
Cradle-to-Grave vs Cradle-to-Cradle
| Cradle-to-Grave | Cradle-to-Cradle | |
|---|---|---|
| Flow | Linear: raw materials → product → waste | Circular: all outputs are nutrients for the next cycle |
| End-of-life | Landfill / incineration | Recovery as biological or technical nutrient |
| Default assumption | Waste is inevitable | Waste = a design failure |
| Example | Disposable coffee cup | Refillable Loop packaging · Patagonia Worn Wear |
The two engineering communiqués — what chem engs committed to
London Communiqué (10 April 1997 · 18 societies)
“The key challenge for our profession in the twenty-first century is to use our skills to improve the quality of life, foster employment, advance economic and social development, and protect the environment ... We will work to make the world a better place for future generations.”
Specific commitments: design innovative + energy-efficient + cost-effective processes; achieve the highest standards of safety; provide shelter, clothing, food, drink, and good health products; engage in honest public dialogue.
Melbourne Communiqué (27 September 2001 · 20 societies)
Reaffirmed and extended the London pledge, with explicit reference to climate change: “We must promote a better understanding of the complex science surrounding climate change, while also striving to develop and implement sound technologies to mitigate its effects.”
Life Cycle Assessment (LCA)
Quantifies environmental impacts across a product’s entire life:
- Raw-material extraction
- Manufacture
- Transport / distribution
- Use
- End-of-life (reuse, recycle, recover, dispose)
Standardised in ISO 14040 (framework) and ISO 14044 (requirements + guidelines). Four LCA phases: goal & scope → inventory analysis → impact assessment → interpretation.
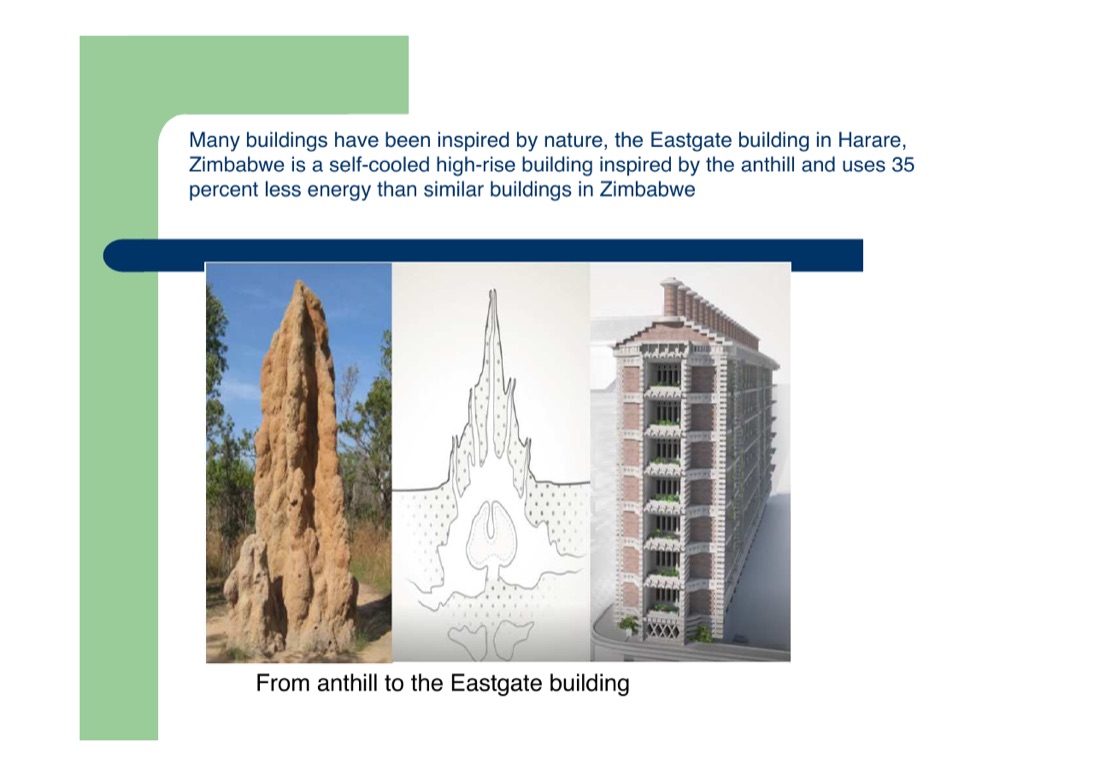
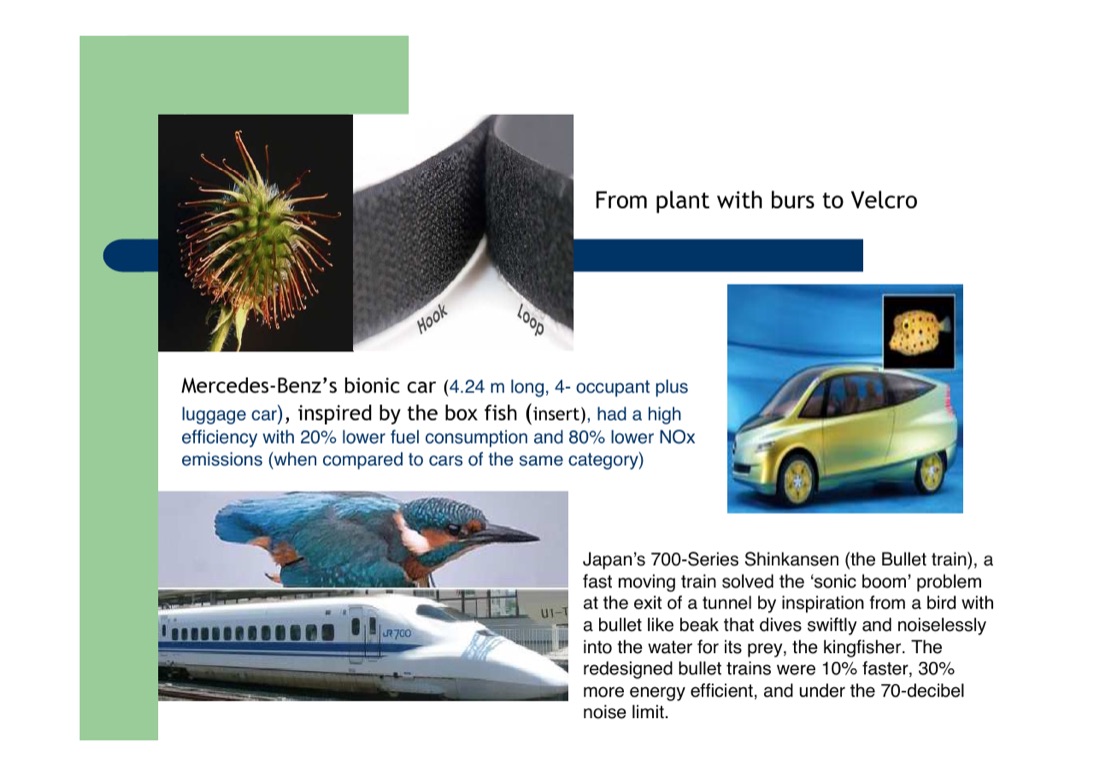
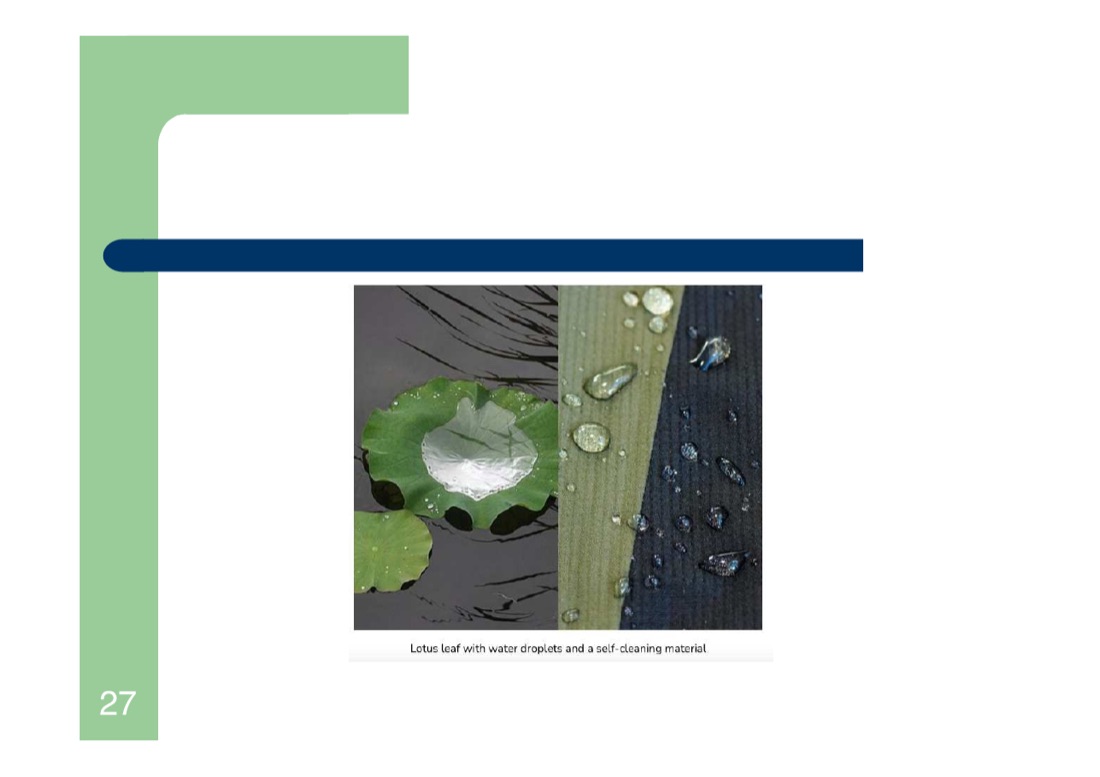
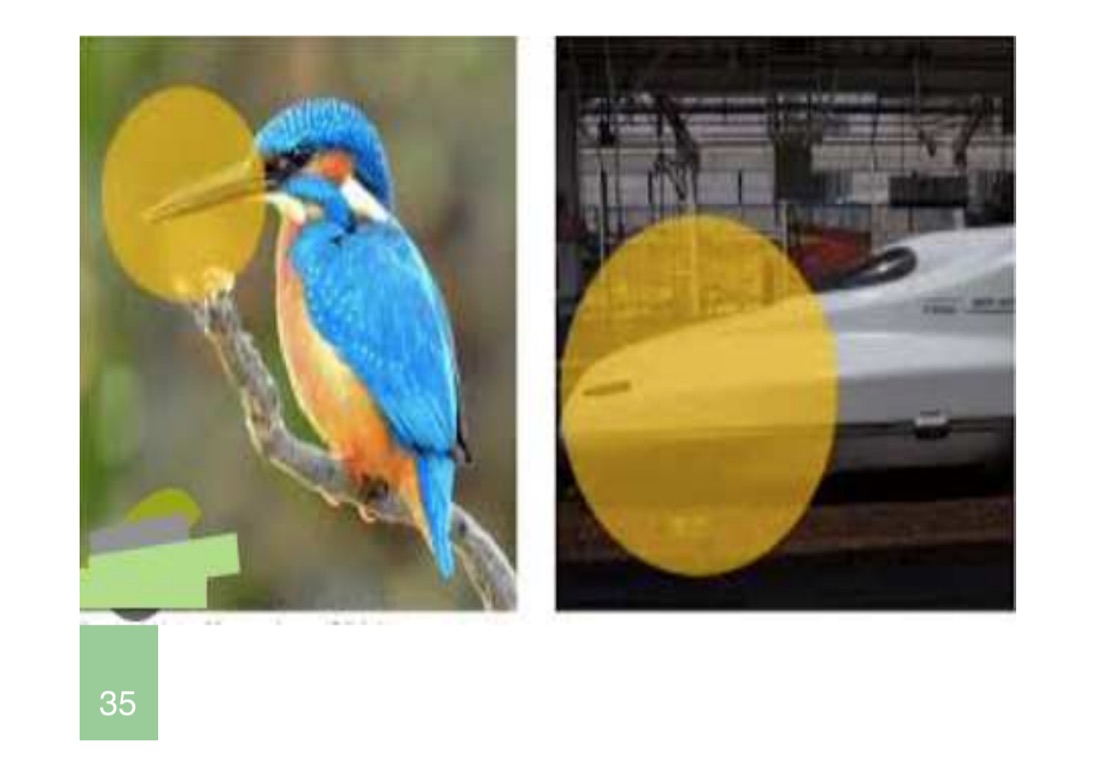
🌿 Biomimicry — “learning from and emulating natural strategies”
Coined by Janine Benyus (1997). The premise: nature has run a 3.8-billion-year R&D programme; most engineering problems have already been solved by some organism. Tap into that.
The 3 Ms of biomimicry:
- Model — study how nature solves a similar problem
- Measure — quantify nature’s performance as the benchmark
- Mentor — let nature define what is well-designed (ethics of impact on living systems)
📑 Slide gallery — Module VIII (Sustainable Development + Biomimicry)
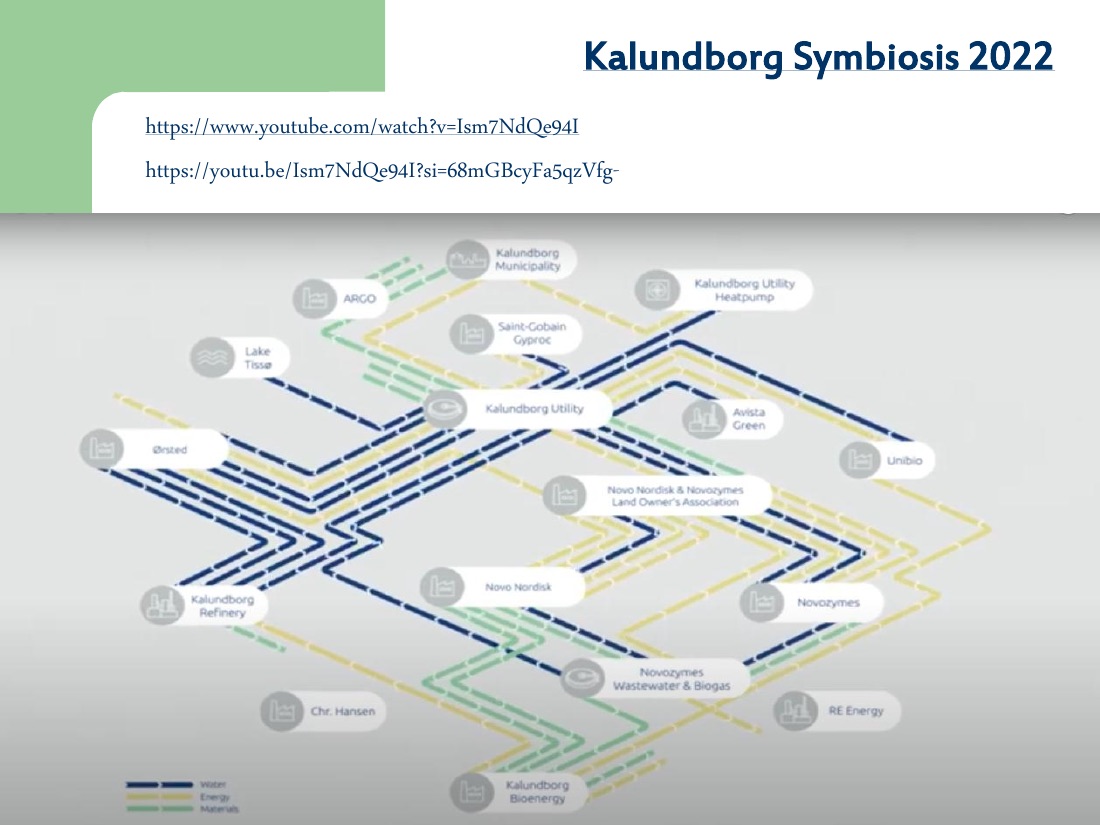
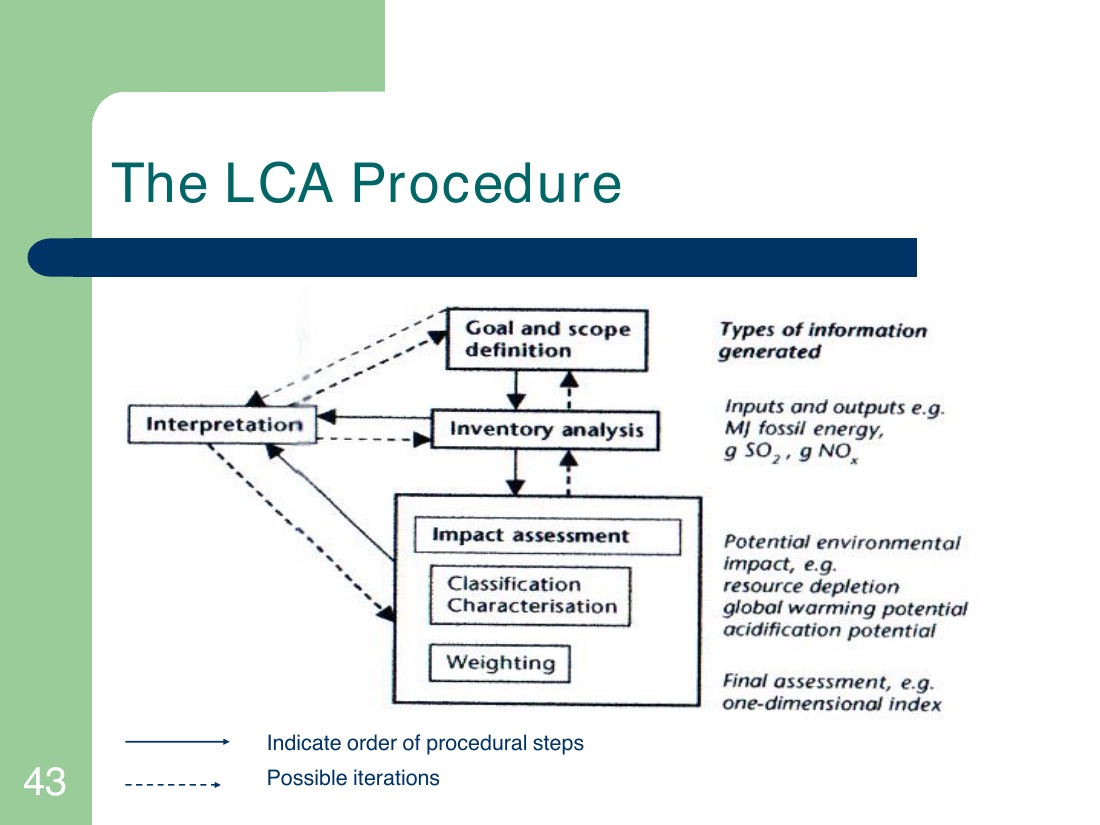
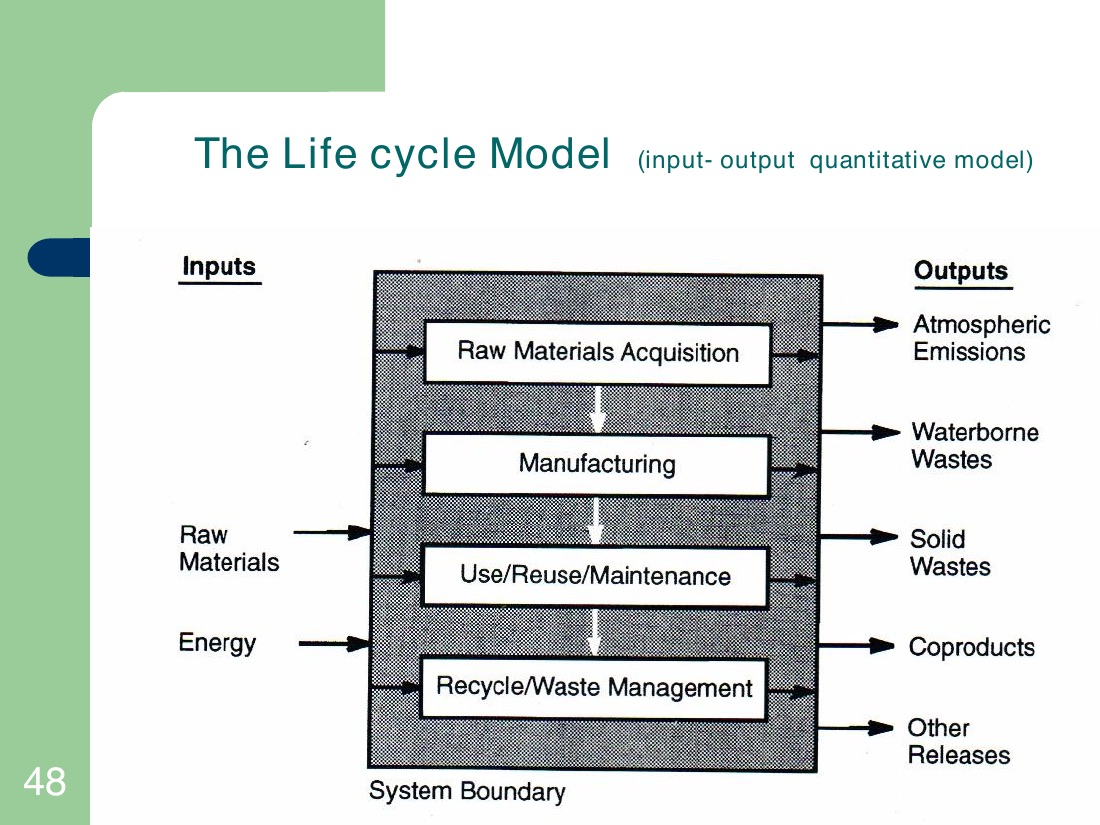
🌿 Biomimicry pairings (Module 11 PDF)
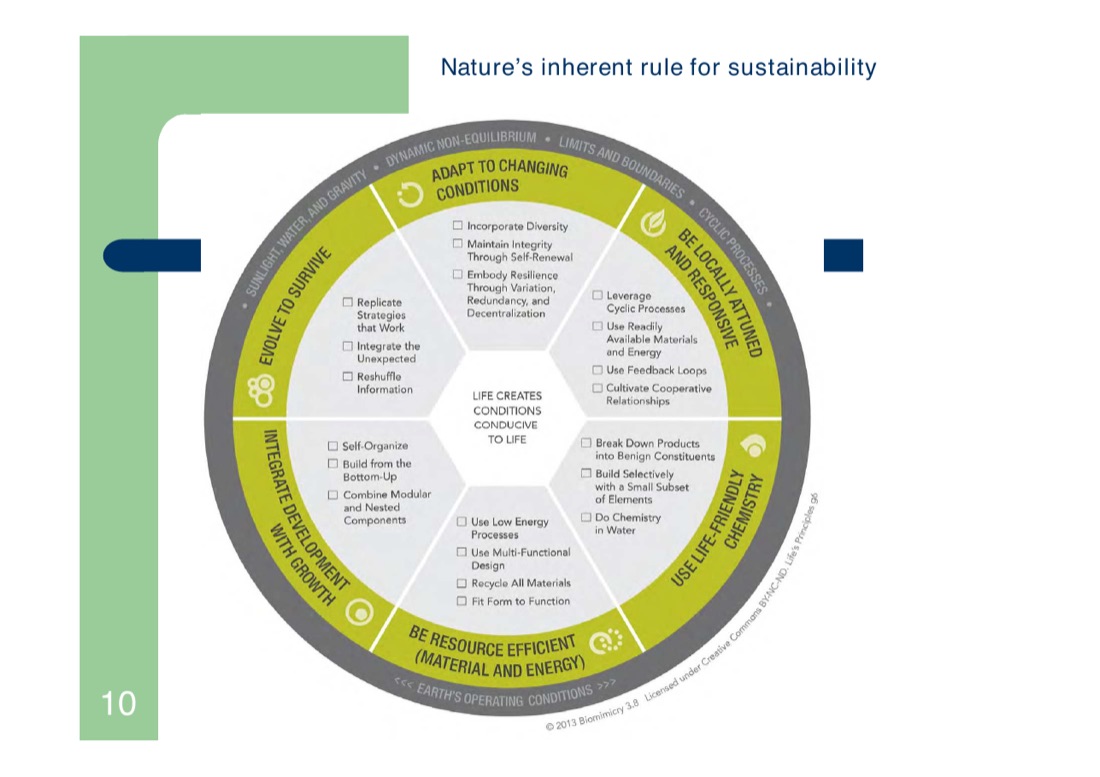

Other Topics — Ethics · Noise · Radiation · Digital
Why this module exists
“Many environmentally related decisions are related more to ethics than to engineering.”
The lecturer’s framing: technology can solve almost any pollution problem — but whether we choose to is a moral question. This module collects four corners of pollution that don’t fit Air/Water/Solid: an ethics frame, plus three under-discussed pollutants — noise, radiation, and digital.
1 · Environmental Ethics — three schools
- Anthropocentric (human-centred) — nature has value only as a resource for human benefit. Default in most engineering codes.
- Biocentric — every living organism has intrinsic value (not just utility).
- Ecocentric — whole systems (species, habitats, processes) have intrinsic value, independent of any individual organism.
The lecturer’s line: “Even if the human race is considered the primary concern of society, animals and plants are in no way less important. They have a right to get their fair share of existence.”
2 · Noise Pollution — the dB scale
Sound intensity covers ~12 orders of magnitude — so we use a log scale. Key rules:
- +10 dB = 10× sound intensity, perceived as roughly 2× as loud
- +3 dB = 2× intensity
- dB(A) = A-weighted decibel — adjusts for human-hearing frequency response
WHO recommended limit: ~70 dB(A) averaged over 24 hours to avoid hearing damage. Short-term > 120 dB causes immediate damage.
Transportation is the dominant noise source (road, rail, aviation). Industrial noise is engineered with the same hierarchy used for emissions: source modification → barriers → personal protection.
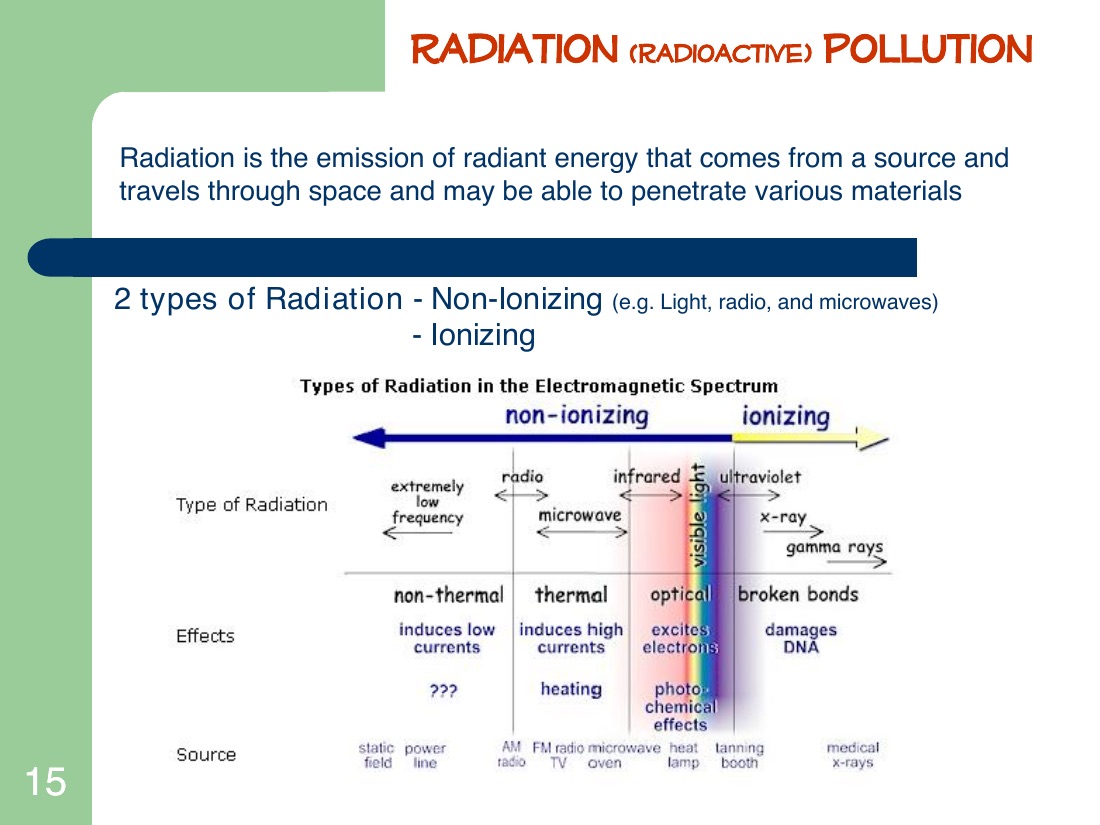
3 · Radiation Pollution
| Ionising | Non-ionising | |
|---|---|---|
| Examples | α particles, β particles, γ rays, X-rays, UV-C/UV-B | Radio, microwave, visible light, UV-A, infrared |
| Mechanism | Knocks electrons off atoms → DNA damage | Mostly thermal (heating); no atomic ionisation |
| Health | Cancer, leukemia, genetic mutations, life-span shortening | Heating effects; eye damage at very high doses |
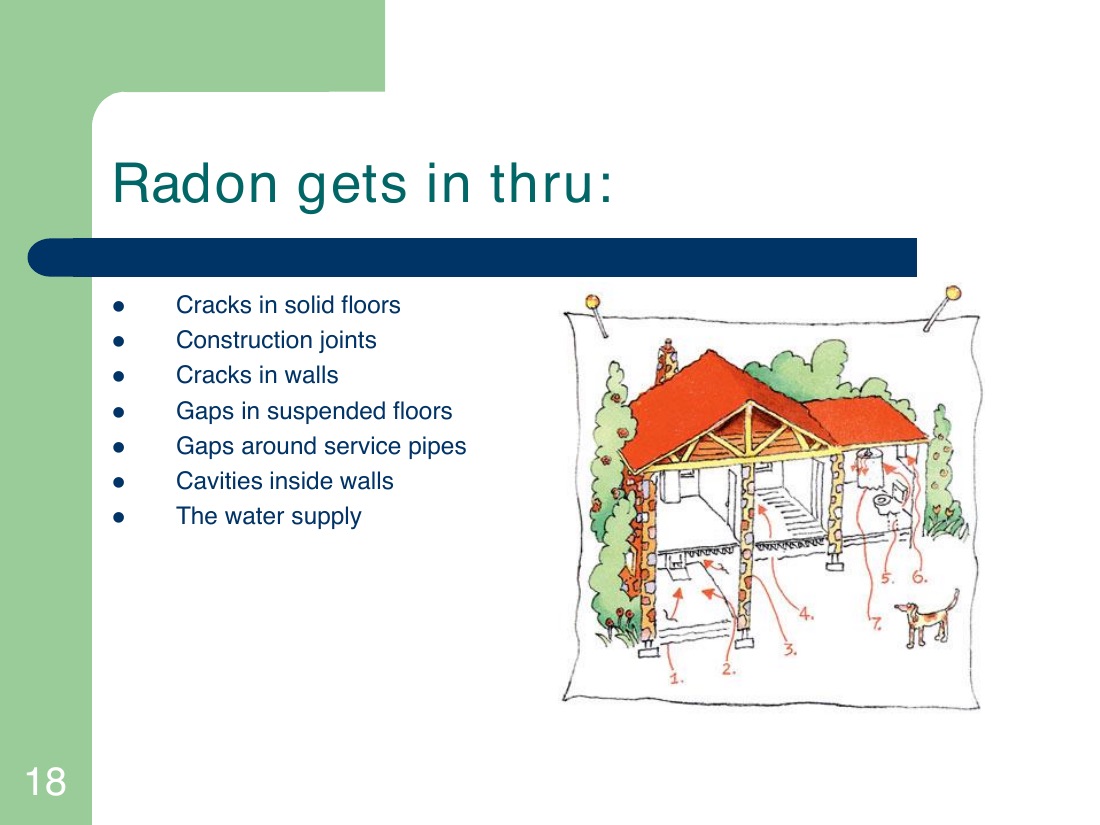
The radon problem — indoor radiation
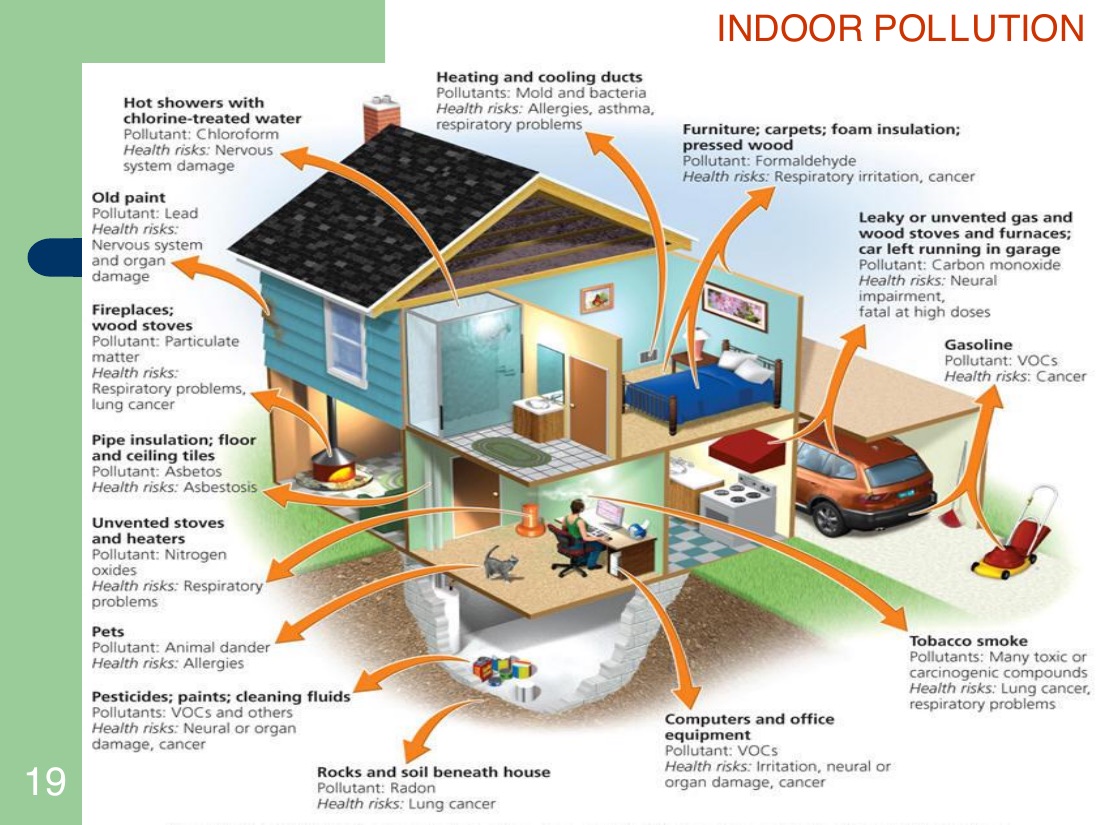
The US EPA ranked indoor air pollution as the #1 cancer-risk source in 1990. Of indoor pollutants, radon is the second leading cause of lung cancer (after smoking). 1 in 15 US homes test high. Entry routes: floor/wall cracks, construction joints, gaps around service pipes, water supply.
The control principle is ALARA — As Low As Reasonably Achievable: minimise exposure through distance, shielding, time. Originated in radiation protection; the same logic applies to chemical exposure.
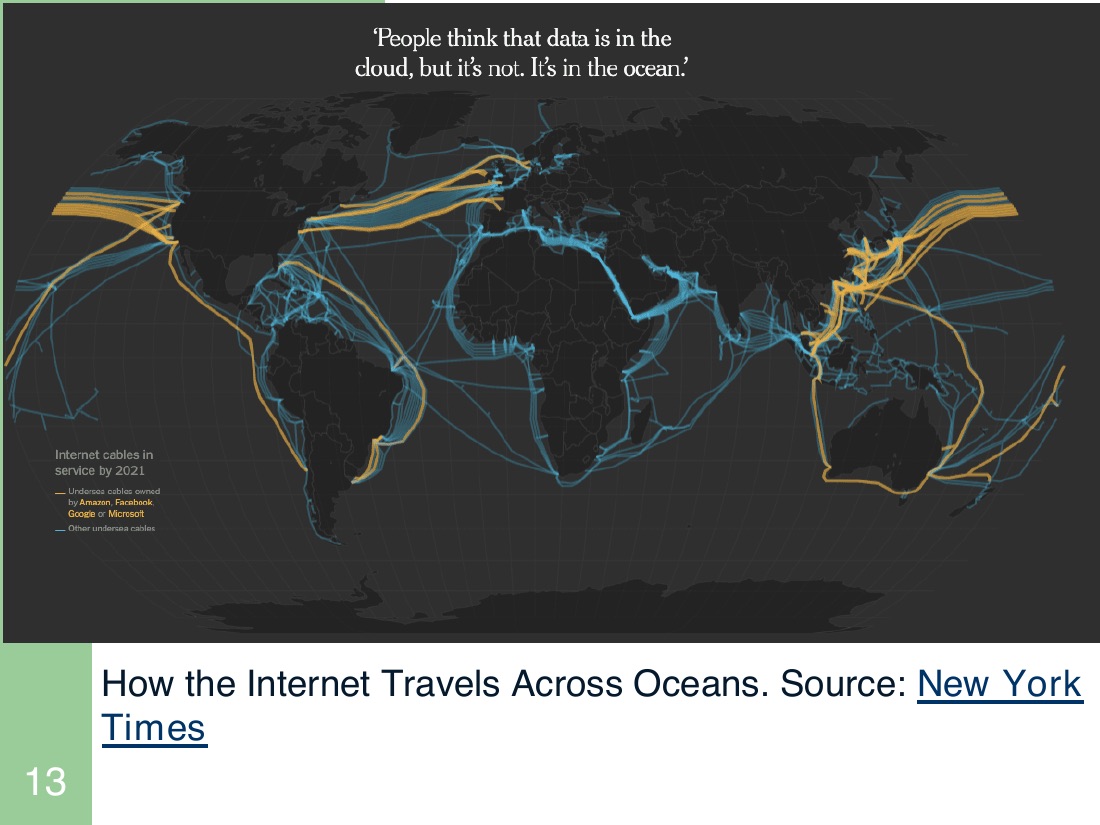
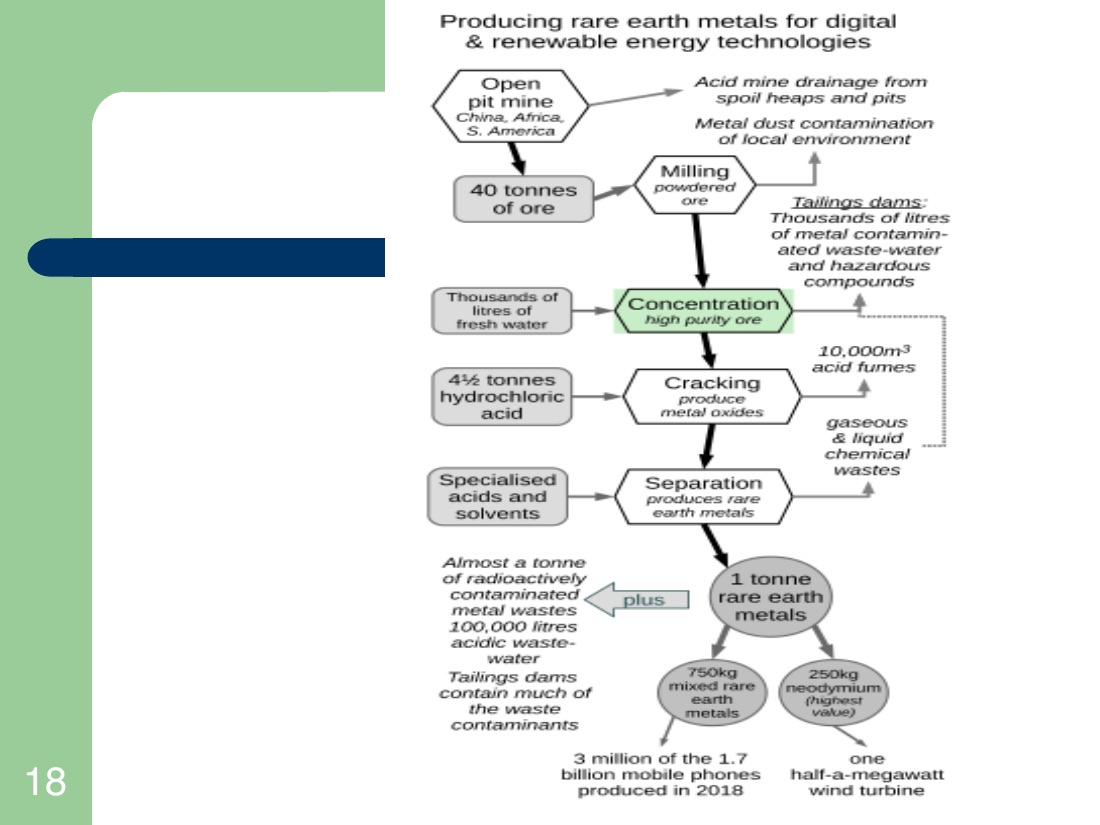
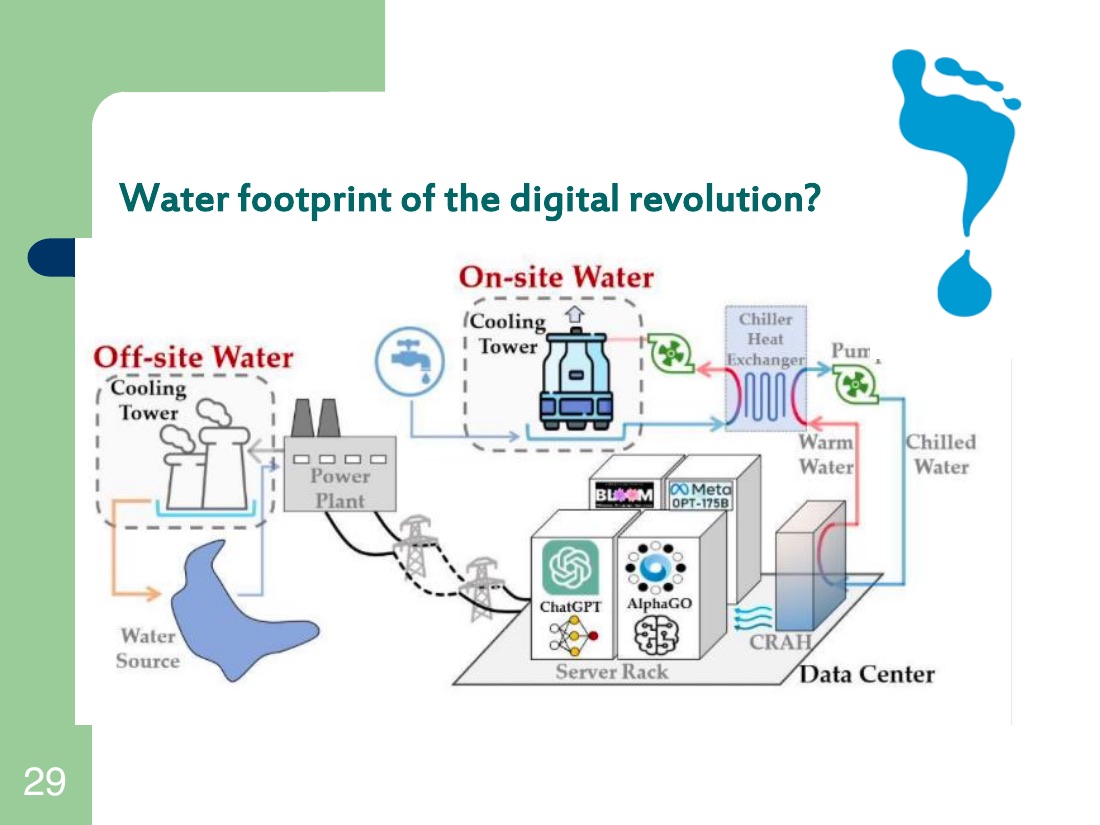
4 · Digital Pollution — the hidden footprint
The ICT (Information & Communication Technology) sector now emits roughly ~4% of global CO₂ — comparable to aviation. Data centres alone are ~1%, and AI training has spiked the figure.
- Data centres — energy-hungry compute + cooling. A single hyperscale facility uses MW-scale electricity continuously.
- Network infrastructure — transmission, 5G, undersea cables.
- Device manufacturing — rare-earth extraction; conflict minerals; lifecycle emissions.
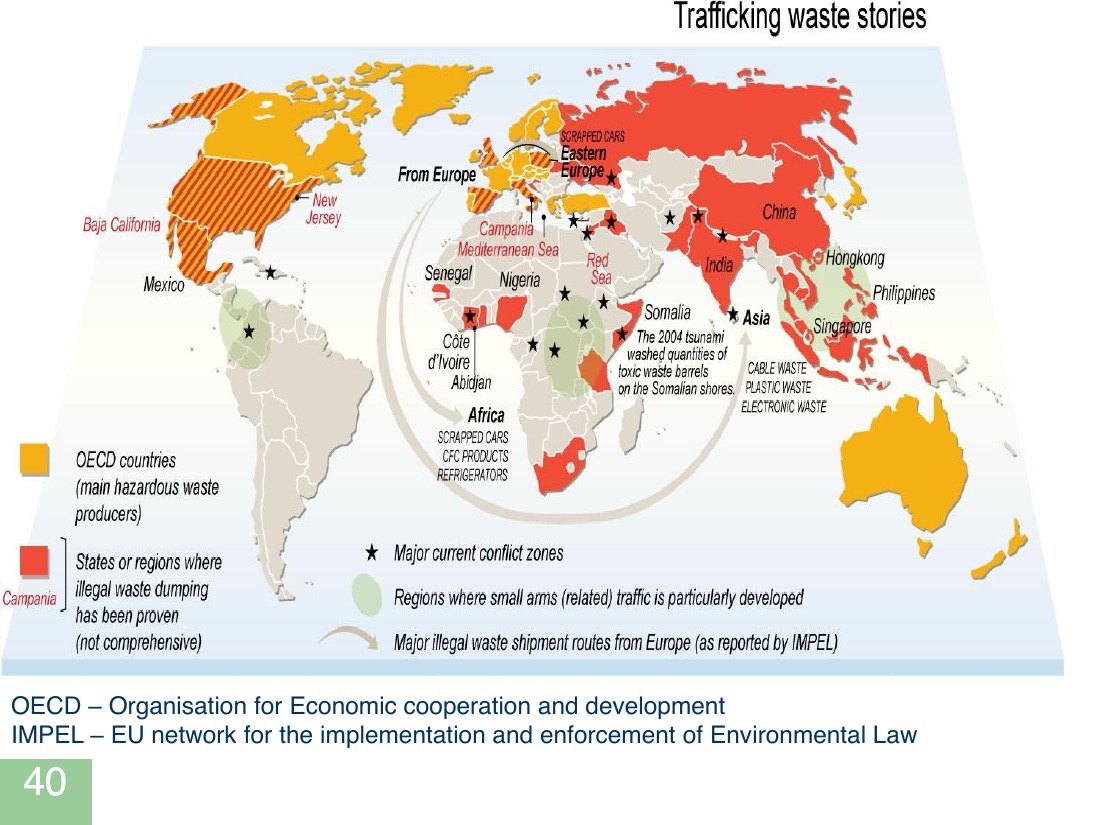
- E-waste — short device lifespans + poor recycling = heavy-metal contamination, often dumped on West Africa & Asia.
- AI training — a large model training run can emit as much CO₂ as five cars over their entire lifetime.
The paradox: “green” digital tools (e-receipts, video calls instead of flights) rely on physically dirty supply chains. The engineering response is energy-efficient architectures, longer device lifespans, and right-to-repair laws.
📑 Slide gallery — Module IX (Ethics · Noise · Radiation · Digital)
💻 Digital Pollution (Module 10 PDF)

Master Quiz
Twenty questions sampled across all topics — with explanations after each one.
Timed Mock Exam
— 30 questions · 60 minutes · no answers shown until you submit. Simulates the real exam pressure. —
Tolu’s Vault
Fifty questions set by Prof. Tolu Ajayi in a previous CHG 569 exam. Same person setting your test this semester — the single highest-signal practice on this site. Drilled into the same patterns, phrased the same way, hitting the same emphases. This is gold.